
Inventory flow chart for retail sector


Try Before you Buy Download Free Sample Product
 Impress Your
 Audience
Editable
of Time


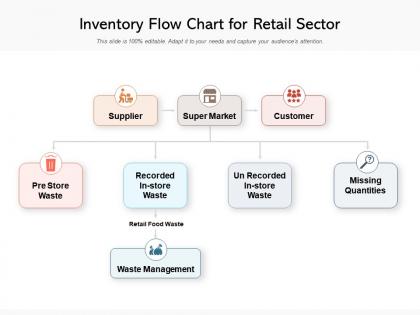
Introducing our Inventory Flow Chart For Retail Sector PowerPoint Presentation Slide. Engage in successful retail inventory management for your company by taking the aid of this PPT template. This PPT slide is explicitly designed to illustrate the flow diagram for your company’s store inventory management. Select this PPT layout to exhibit each step starting from supplier to supermarket clearly and concisely. Create a strategy for proper waste management for your organization by taking the aid of this PPT design. With this PPT visual, you can define the operational processes of your company in an attractive yet informative manner. Provide an insight into the market workflow to structure your retail processes cleverly. Handling inventory can be difficult; thus, take advantage of this PPT graphic to elaborate on the retail process in an organized way. Download this PowerPoint presentation slide to create a roadmap for the growth and expansion of your business.
People who downloaded this PowerPoint presentation also viewed the following :
Inventory flow chart for retail sector with all 2 slides:
Give your audience a fulfilling experience. They will find our Inventory Flow Chart For Retail Sector elevating.


FAQs for Inventory flow chart
The main components of an inventory flow chart include procurement processes, receiving operations, storage allocation, order fulfillment, shipping procedures, and inventory tracking systems. These components work together by streamlining warehouse operations, enhancing visibility across supply chains, and automating stock replenishment, with many retail and manufacturing organizations finding that integrated flow charts significantly reduce carrying costs while improving customer satisfaction.
**INPUT**: How can an inventory flow chart improve supply chain visibility? **OUTPUT**: An inventory flow chart improves supply chain visibility by mapping product movement, identifying bottlenecks, tracking stock levels across locations, and standardizing processes throughout the distribution network. Through visual representation, organizations streamline warehouse operations, enhance demand forecasting, and minimize stockouts, with many manufacturing and retail companies finding that improved transparency ultimately delivers faster response times and reduced operational costs. **Word count: 60 words**
**INPUT**: What software tools are best for creating inventory flow charts? **OUTPUT**: Top software tools for creating inventory flow charts include Microsoft Visio, Lucidchart, Draw.io, Creately, and SmartDraw, each offering specialized templates and inventory-specific symbols. These platforms streamline warehouse mapping, supply chain visualization, and stock movement tracking by providing drag-and-drop functionality, real-time collaboration features, and integration capabilities, with many logistics companies finding that digital tools enhance operational transparency and inventory accuracy. **Word count**: 60 words
An inventory flow chart aids in identifying bottlenecks by visualizing material movement, highlighting delays, pinpointing slow-moving processes, and revealing capacity constraints throughout the supply chain. Through strategic mapping, organizations can streamline operations, optimize resource allocation, and enhance inventory turnover, with many manufacturing and retail companies finding that visual analysis ultimately delivers faster fulfillment and improved operational efficiency.
An inventory flow chart enhances inventory management strategies by visualizing stock movement, identifying bottlenecks, optimizing reorder points, streamlining warehouse operations, and improving demand forecasting accuracy. Through clear process mapping, organizations can reduce carrying costs, minimize stockouts, and accelerate order fulfillment, with many retail and manufacturing companies finding that visual workflow optimization ultimately delivers better inventory turnover and enhanced operational efficiency.
Data accuracy serves as the foundation for inventory flow chart effectiveness, ensuring reliable tracking, precise demand forecasting, optimal stock levels, and informed decision-making across all supply chain touchpoints. Without accurate data, organizations experience costly stockouts, excess inventory, and inefficient resource allocation, while accurate information enables streamlined operations, reduced carrying costs, and enhanced customer satisfaction through consistent product availability.
Industries like manufacturing, retail, healthcare, automotive, and food services benefit significantly from inventory flow charts through enhanced tracking, reduced waste, and streamlined operations. Manufacturing companies use them to optimize production schedules and minimize bottlenecks, while hospitals leverage these charts for medical supply management and retail chains for seasonal demand planning, ultimately delivering cost reductions and improved customer experiences.
Visual representations in inventory flow charts significantly enhance stakeholder understanding by transforming complex data into intuitive diagrams, reducing interpretation time, and highlighting critical bottlenecks or inefficiencies. These visual tools enable managers, suppliers, and team members to quickly identify process gaps, track resource movement, and make informed decisions, with many organizations finding that visual inventory mapping improves cross-departmental collaboration and accelerates problem-solving efforts.
**INPUT**: What key performance indicators (KPIs) can be tracked using an inventory flow chart? **OUTPUT**: Inventory flow charts enable tracking of turnover rates, carrying costs, stockout frequencies, lead times, and order accuracy percentages. These visual tools streamline performance monitoring by identifying bottlenecks, optimizing reorder points, and enhancing demand forecasting, with many retailers and manufacturers finding that comprehensive KPI tracking ultimately delivers reduced operational costs and improved customer satisfaction.
Inventory flow charts should be updated quarterly or whenever significant process changes occur, including new suppliers, technology implementations, seasonal adjustments, or workflow modifications. Many manufacturing and retail organizations find that regular reviews ensure accuracy in tracking stock movements, identifying bottlenecks, and maintaining operational efficiency, ultimately delivering better inventory control and cost management.
Common mistakes include overcomplicating the process with unnecessary steps, failing to clearly define decision points, omitting key stakeholders from the workflow, and neglecting to include contingency paths for exceptions. These oversights can create confusion in warehouse operations, retail management, and manufacturing processes, while well-designed flowcharts streamline inventory tracking, reduce errors, and enhance operational efficiency across supply chain teams.
An inventory flow chart facilitates better communication by providing a standardized visual framework that eliminates confusion, ensures consistent processes, and creates shared understanding across departments. This visual approach enables warehouse managers, procurement teams, and logistics coordinators to quickly identify bottlenecks, coordinate restocking activities, and maintain alignment on inventory priorities, ultimately streamlining operations and reducing miscommunication costs.
Color coding in inventory flow charts delivers enhanced visual clarity, faster decision-making, improved error reduction, streamlined process identification, and better team communication. Through strategic color schemes, warehouses and manufacturing facilities can instantly distinguish between product categories, priority levels, and workflow stages, while reducing training time for new staff, ultimately enabling more efficient inventory management and fewer costly operational mistakes.
Lean principles can be incorporated by mapping value streams, identifying waste points, implementing pull systems, establishing continuous flow paths, and standardizing processes throughout the inventory journey. These methodologies streamline operations by reducing excess stock, minimizing handling steps, and accelerating cycle times, with many manufacturing and retail organizations finding that lean-optimized flow charts ultimately deliver significant cost reductions and enhanced operational efficiency.
**INPUT**: What are some best practices for presenting inventory flow charts in business meetings? **OUTPUT**: Best practices include using clear visual hierarchies, highlighting critical bottlenecks, incorporating real-time data metrics, and focusing on actionable insights rather than complex details. These approaches enhance stakeholder understanding by streamlining decision-making processes, facilitating cross-departmental alignment, and ultimately delivering faster inventory optimization, with many organizations finding that simplified presentations accelerate implementation timelines. **Word count: 54 words**
No Reviews