The foundation of business models, based on products as the value offered, is that you first manufacture these. After being made, these products, may be pieces of garments, books, jewellery, chips, bags, almost anything under the sun, are distributed across channels to the end-place of sale, usually a retail shop. With technology coming, however, can be anything, even an online store like Amazon. But, there is always the physical store to store, and take care of. Hence, in a sale process, inventory builds up. Put simply, inventory is a count of the amount of all goods, materials etc. that has a business has unsold.
Over time, this count of stock (anything that was kept on Stock-Keeping Units (SKUs) increases) as some items sell at a slower pace than others. Keeping tabs of inventory and preparing an inventory report is, thus, essential for businesses to ensure products sell and nothing remains unsold.
The ideal scenario is that the total quantity of stock stored in a store or place of sale is sold within a specified time, but this seldom happens, making it even more critical to prepare professional inventory reports.
Not doing this means that total cost of doing business increases, as some stock will never sell once it is past the use-by-date or it loses customer utility. Using a professionally-done inventory report, companies can even hope to protect its sales margins, averting a serious hit to the bottom line.
Such is the importance of inventory management and stock management that some of today’s fast-paced businesses require inventory dashboards. Click here to access inventory dashboards which are even linked to Key Performance Indicators (KPIs). These act as major inputs in decision-making
To help businesses with this major pain point of getting inventory reports and acting on it on time, SlideTeam offers readymade, content-ready PPT Templates to ensure inventory management is easily done.
The 100% customizable nature of the templates provides you with the desired flexibility to edit your presentations. The content ready slides give you the much-needed structure.
Let us explore some of these inventory templates to help you garner improved efficiencies.
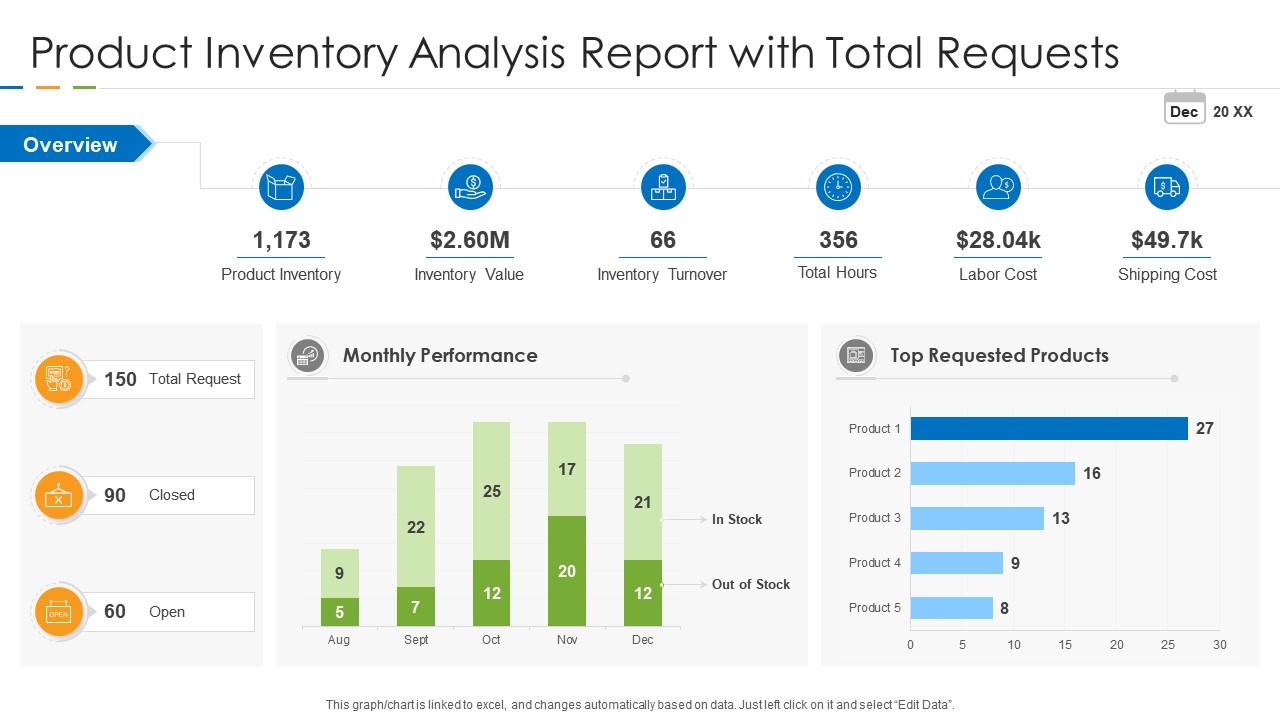
Template 1: Product Inventory Analysis Report With Total Requests
Start with an overview of your product inventory, inventory value, inventory turnover, labor cost and top requested products in this inventory analysis report on product, with total requests. Showcase that you are tracking monthly performance of your inventory management with a bar graph on items out of stock items versus items in stock.
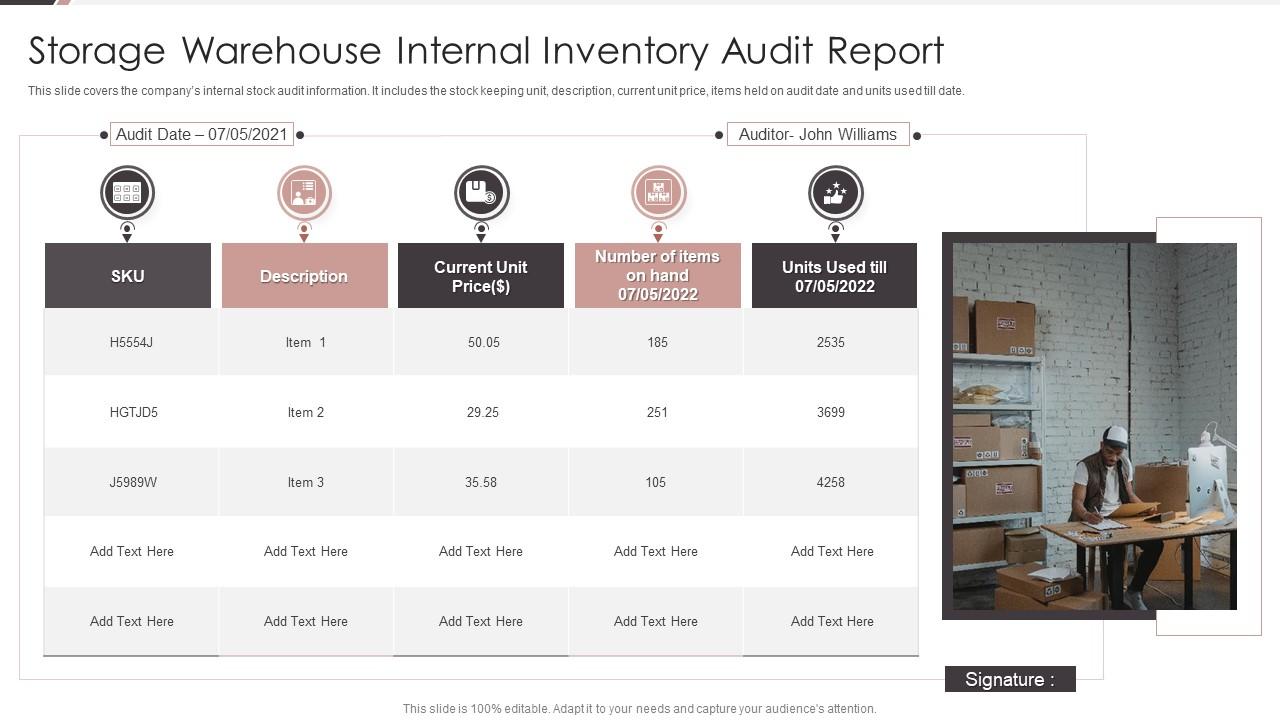
Template 2: Storage Warehouse Internal Inventory Audit Report
This audit report on storage warehouse internal inventory includes SKU description in terms of products kept on it; current unit price, items held on audit date and units used to date. It helps you map your SKU with items stored on it and the rate at which each sells. Download now to be aware of the items that are fast-moving and need to be replenished at speed.
Template 3: Inventory Report PowerPoint PPT Template Bundles
This presentation template starts with an e-commerce warehouse daily inventory movement report. It covers items involved in a transaction and a code indicating the type of inventory movement. Use this PPT to find current inventory location, destination available quantity, all in real-time and required action to be taken. The well-designed icons service frame of reference for correct input of data. Also, use this complete deck for pending status report, internal inventory audit report with SKU mapped to items. Showcase your knowledge of inventory management and win clients with a download of this template. Health care order fulfilment and sales report and machinery spare parts inventory dashboard are part of the comprehensive product.
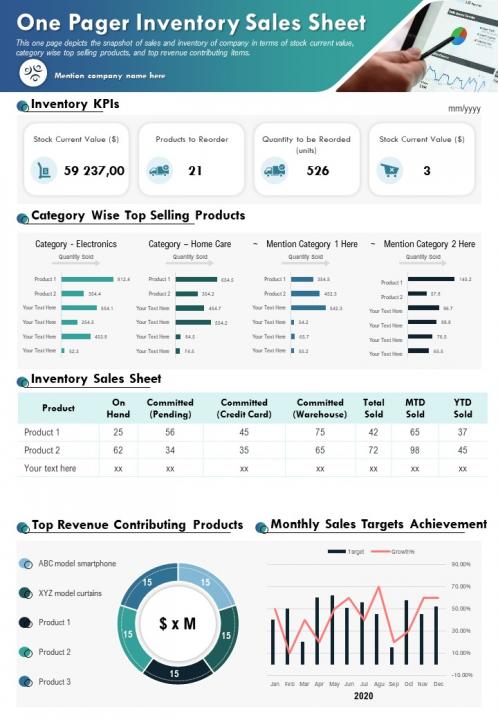
Template 4: One-Pager Inventory Sales Sheet Presentation Report Infographic
Use this one-pager PPT Presentation to see how deeply sales and inventory are linked and how a change in one impacts the other. Start with a record of Inventory KPIs with quantity to be reordered a major indicator. At any point of time, optimum inventory levels must be maintained and hence sales must be such that there is little carrying cost of inventory. Other sales parameters that you can highlight using this template are inventory sales sheet mapped to product types; monthly sales target achievement; top revenue contributing products and company-wise top sellers. Total quantity sold, month-to-date products sold and year-to-date products sold all contribute to better inventory reporting.
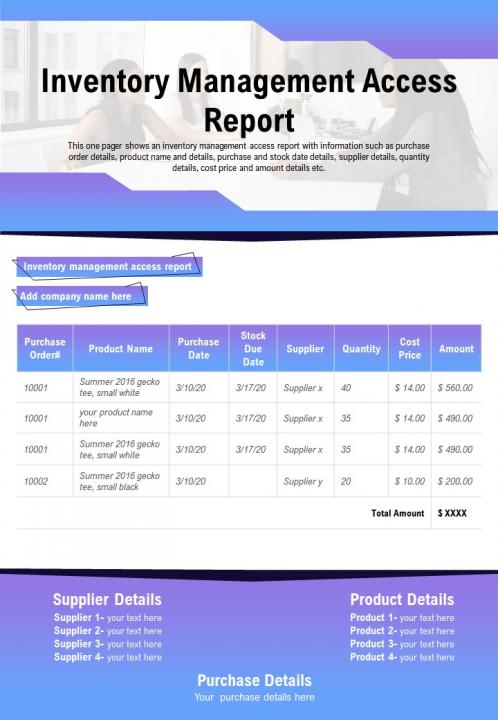
Template 5: Inventory Management Access Presentation Report Infographic
This PPT Presentation showcases purchase order report, product name and details as a convenient inventory reporting format. List purchase orders and map these to products, stock due date, supplier, quantity, cost price and amount. This wonderfully-practical design has real-estate at the bottom of the slide to help you record supplier (up to 4, but can be increased or decreased due to the editable nature of the template) and product details. Even purchase details can be added. Download now and showcase your expertise in simplifying a complex inventory report into one that businesses can adopt.
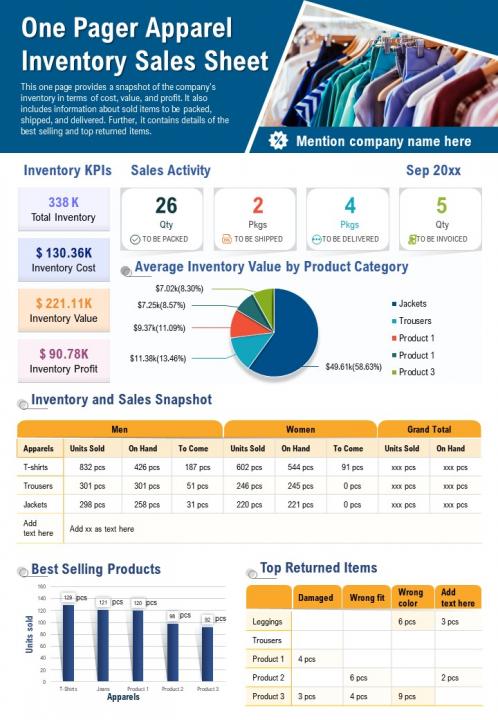
Template 6: One-Pager Apparel Inventory Sales Sheet Presentation Report Infographic
This Inventory Report, a Sales Sheet, of apparel business in a one-pager format illustrates a snapshot of a company’s inventory in terms of cost, value and profit. In inventory KPIs, the absolute result the company expects is exhibited. For instance, we have an inventory cost, and there is value to be earned from it on sale, which is referred to as inventory sales. The difference between inventory cost and inventory value is the inventory profit. Now, if stock remains unsold, the inventory value is not fully realized, reducing the profit. Use this inventory report to evaluate if this is happening in either your own or your client’s case. The inventory and sales snapshot tells us how fast stock is sold. Download now and get perfect at how to stock just right.
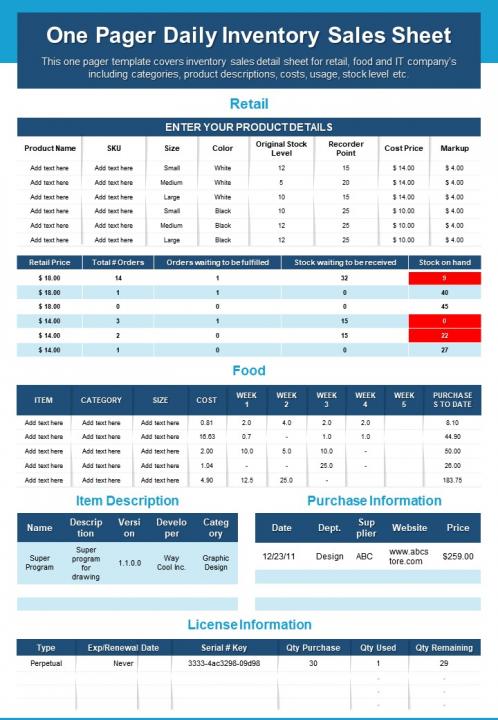
Template 7: One-Pager Daily Inventory Sales Sheet Presentation Report Infographic
Use this one-pager template to exhibit your knowledge of inventory sales detail sheet for retail, food and IT companies. You can map you inventory in terms of product descriptions, costs usage and stock level. In retail, know your product by color, original stock level, cost price and markup. All are linked to respective SKUs. Orders yet to be delivered and stock on hand are important parameters listed column-wise. For IT companies, license information can be added with serial key and expiry/ renewal date. Download now for an easy way to track your inventory daily.
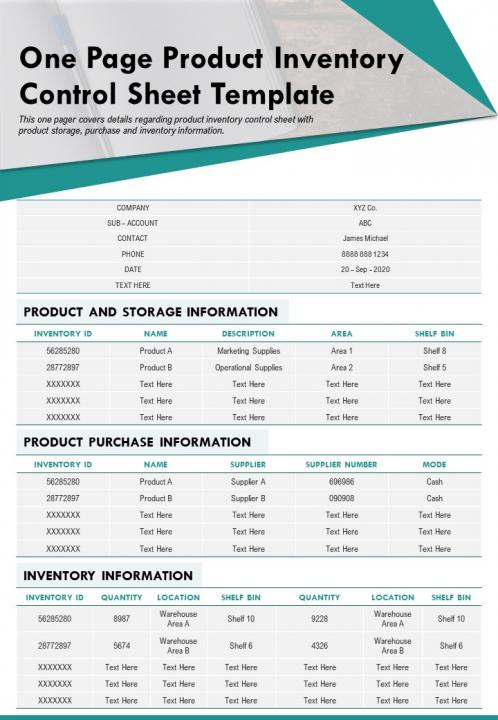
Template 8: One-Pager Product Inventory Control Sheet Template Presentation Report Infographic
This PPT presentation on inventory control gives a business the much-needed management input on knowing exactly where each piece of stock has been purchased and stored. Use this presentation template to highlight three broad buckets of product and storage information, product purchase information and inventory information. The contact person in-charge of inventory control can also be mentioned. Download now to take advantage of well-organized presentation that enhances efficiency.
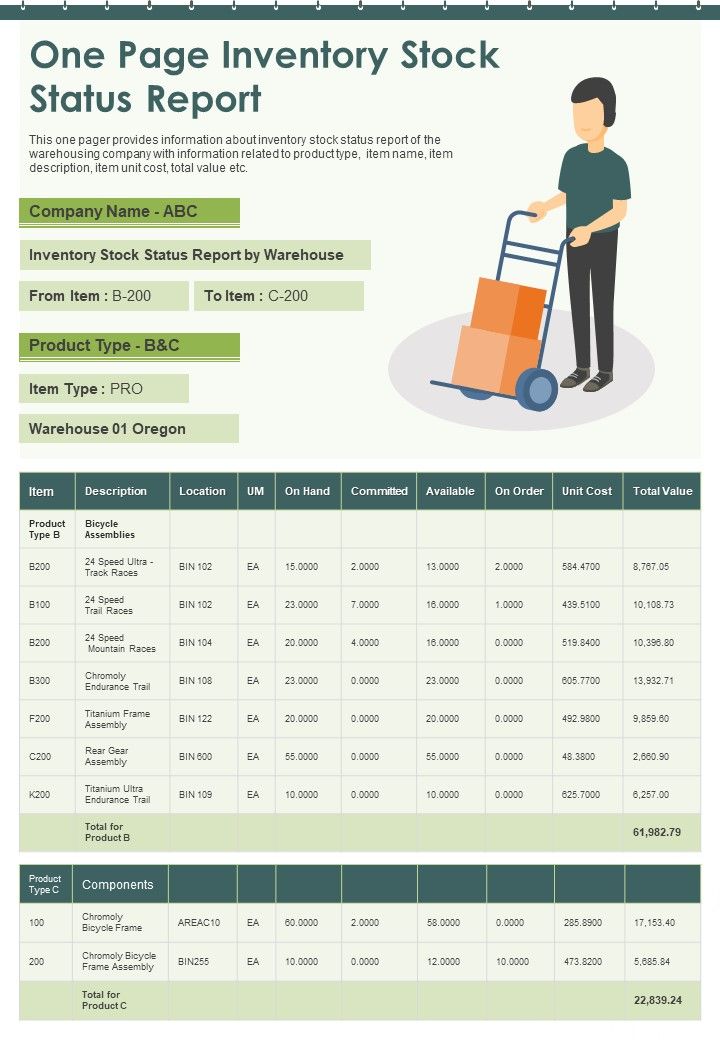
Template 9: One-Pager Inventory Stock Status Report Presentation Report Infographic
This inventory stock status report takes a warehousing company as illustration, lending itself to 100% customization. You list the company name and the items covered as well as product types and warehouse associated with it. The earmarked columns give you complete information on items under each product type. Use this PPT presentation to inform stakeholders of availability of each item, unit cost, location of warehouse, availability on hand and total value. Impress your audience with such due diligence in your presentation.
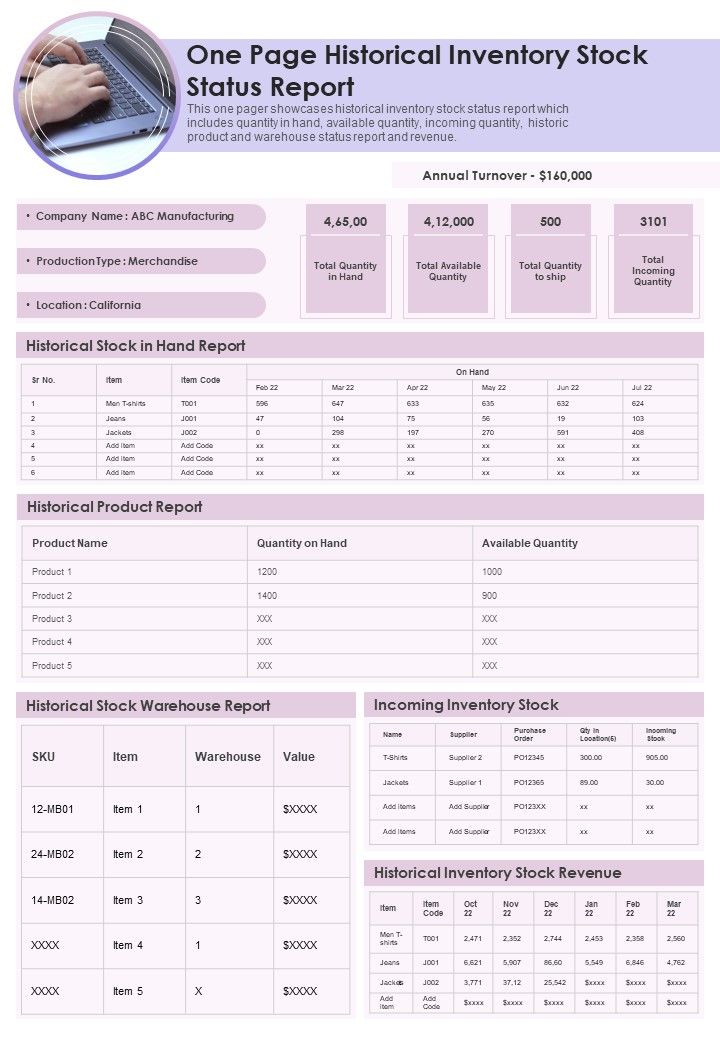
Template 10: One-Pager Historical Inventory Stock Status Report Presentation Infographic
In inventory management, historical data is also of relevance as future production is linked to it. This one-pager PPT Template showcases historical inventory status report. This inventory report shows quantity in hand, available quantity, incoming quantity historic product and warehouse status report and revenue. Start with highlighting your annual turnover and company name. The other major buckets covered are historical stock warehouse report, incoming inventory stock and historical inventory stock revenue. Use this template to showcase you are on top of the inventory reporting domain to clients. Download Now!
STRIKE A BALANCE
In an ideal world, businesses should not have to keep inventory. They should be able to buy materials as and when needed. This will, however, involve getting it at high prices as it will be ordered in small lots. Material could also be delayed in delivery with this strategy, hitting production. For finished goods, producing only what can be sold tomorrow is dangerous as it increases production runs. It might also be infeasible to meet market demand with this methodology of tackling inventory. Yes, it costs to hold inventory, but businesses need to live with inventory, striking a fine balance. You need to keep this in mind, as you frame your business strategy framework. Access the best such frameworks with a click here.
FAQs on Inventory Report
What is in an inventory report?
An inventory report summarizes the count of existing stock that a business rules. It is both a quantitative and qualitative tool to assess business performance and judge whether hidden inefficiencies can be eliminated from a business management perspective. For instance, you should always have inventory that you believe will be sold as soon as possible. This is because inventory is capital that is tied up in raw materials and finished goods. The efficient use of this capital is what an inventory report aims to bring about. An inventory report uses terms like SKUs, warehouse, sales, stock reports etc.
What are the types of inventory report?
Digging deep into inventory reports, we learn that these are concerned with four major kinds of inventories that business are forced to hold. The four types of inventories are finished good and maintenance inventory report; raw materials and components inventory report; repair and operating supplies inventory report and work in progress inventory report. The idea behind this classification is that varying amount of capital is tied up in each of these assets. Using this categorization, it becomes easier for a large business to manage its inventory.
What is the purpose of an inventory report?
The purpose of an inventory report is to improve business efficiencies. This translates into lower inventory costs in terms of carrying stock stored in your warehouses. An inventory report aims to minimize this cost as money spent on storing does not earn any interest income. An inventory report also identifies fast-moving products and allows comparison between cost of good sales cost of goods sold, sales and inventory levels.




 Customer Reviews

