


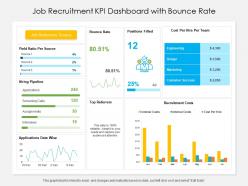
Job recruitment kpi dashboard with bounce rate





Try Before you Buy Download Free Sample Product
 Impress Your
 Audience
 100%
100% Editable
 Save Hours
 of Time


Our Job Recruitment KPI Dashboard With Bounce Rate are topically designed to provide an attractive backdrop to any subject. Use them to look like a presentation pro.
People who downloaded this PowerPoint presentation also viewed the following :
Job recruitment kpi dashboard with bounce rate with all 2 slides:
Use our Job Recruitment KPI Dashboard With Bounce Rate to effectively help you save your valuable time. They are readymade to fit into any presentation structure.
FAQs for Job recruitment kpi dashboard
So the basics you definitely need are time-to-fill, cost-per-hire, and quality of hire. Source effectiveness is huge too - shows you which job boards or whatever are actually worth the money. Track your offer acceptance rate and how satisfied candidates are with the process. Interview-to-hire ratio tells you if you're screening well or just wasting everyone's time. Pipeline health is clutch for seeing if you've got enough people at each stage. Oh, and don't skip diversity metrics and hiring manager satisfaction - they're the ones who'll throw you under the bus if things go wrong. Start with these and add more based on what your exec team obsesses over.
So recruitment dashboards are pretty clutch for finding where your hiring gets stuck. Track how long screening takes, whether interviews drag on forever, or if approvals move at a snail's pace. Think of it like GPS but for recruiting - pinpoints exactly where things slow down. The cool part is comparing time-to-hire between different roles or recruiters to see what actually works. Honestly, some departments are just way faster than others for reasons nobody can explain. Start with your current average, then tackle the worst bottlenecks first.
Honestly, start with 90-day retention and hiring manager satisfaction - those are your quick wins. Time-to-productivity is huge too but harder to track at first. Quality of hire sounds fancy but takes forever to measure properly, so don't stress about that initially. Interview-to-offer ratios give you solid data, plus any assessment scores if you're using those. Your hiring managers' feedback within 30 days is basically gold. Oh, and structured interview scores are great leading indicators - they actually predict who'll succeed. Focus on retention and satisfaction scores first while you build out the rest of your dashboard.
Track demographics at each stage - applications, interviews, hires. Gender, ethnicity, age ranges, whatever matters for your company. Don't go crazy with breakdowns at first though, keep it simple. Monitor your ratios against hiring goals and compare month to month so you'll catch trends. Here's the thing - you've got to measure the whole pipeline, not just who gets hired. That's how you spot where diverse candidates are falling off. I'd start with maybe 3-4 key metrics, then expand once you get the hang of it.
Honestly, source-of-hire tracking is a game changer. Tag every application with where it came from, then review quarterly. You'll start seeing patterns - like maybe your best devs all come through referrals while that pricey job board is basically useless. It's your recruiting funnel data, and once you dig in, you can actually make smart budget decisions. Drop the channels that aren't working. Double down on what brings quality hires. I mean, why keep throwing money at something that doesn't deliver? Start simple and let the data guide your sourcing strategy.
Honestly, daily updates are way too much unless you're hiring like crazy. Weekly works best for most teams - catches problems early without making you obsess over every little change. During busy hiring seasons though? Maybe bump it to every few days. The real trick is just being consistent about it. Pick whatever schedule you can actually follow and automate the data collection if possible (trust me on this one). I'd start weekly and see how it feels. If your hiring situation changes super fast, then maybe increase the frequency. But most places don't need that level of micromanaging.
So for recruitment dashboards, I'd definitely check out Tableau or Power BI first - they're like the gold standard and connect to pretty much any ATS. Google Data Studio is solid too, especially since it's free (can't beat that). Klipfolio's another decent option if you want something less overwhelming. Honestly though? Don't sleep on Google Sheets if you're just getting started. I know it sounds basic but it gets the job done. Power BI probably has the best bang for your buck. Just grab a free trial and see how it plays with your current setup before committing to anything.
Honestly, turning your recruitment data into charts and graphs is a game changer. You'll actually see what's happening instead of drowning in spreadsheet hell. Bar charts work great for basics like time-to-hire - suddenly you can spot which job boards are worth your money and where candidates keep dropping off. I used to hate looking at hiring metrics, but dashboards make everything click. You can compare teams instantly and catch problems before they get worse. Start simple with your main numbers. Trust me, once you see those patterns visually, you won't go back to endless rows of data.
High turnover basically makes your recruitment numbers look awful - you're stuck constantly filling the same roles over and over. I'd track it by department and tenure to catch patterns. Like are people bailing within their first 90 days? That's usually a red flag about onboarding or role expectations. Also watch if certain teams keep bleeding talent while others don't. The tricky part is turnover can make even solid recruiters look bad on paper. Set up some kind of alert system when departmental rates spike, so you can dig into what's actually going wrong before it gets worse.
You know what's crazy? Candidate experience totally makes or breaks your recruitment numbers. Good experience = higher offer acceptance and people actually recommending you to their friends. Bad experience though... yikes. Those candidates will trash-talk you everywhere, which kills your talent pipeline fast. I'd start tracking satisfaction scores and see where people are dropping out of your application process. The feedback at each step is gold - shows you exactly what's going wrong. Time-to-hire improves too when candidates aren't frustrated with your process. It's honestly one of those things that touches everything.
So predictive analytics basically lets you dig into your hiring data and figure out what actually predicts good hires. Way better than just looking at time-to-fill and calling it a day. You can start predicting who'll accept offers, stick around, or crush it at the job based on patterns from past hires. Honestly took our team forever to get the hang of it, but now we spot hiring bottlenecks before they mess us up. Pull your last 2-3 years of data and look for what early signals connect to your best performers. Trust me, it's worth the headache of setting up.
Know your audience first - execs want the big picture stuff like time-to-fill, but hiring managers actually care about pipeline details and which sources work. Don't just dumb everything down though. Create different dashboard views instead. Set up monthly check-ins plus automated alerts when numbers get weird. Honestly, if your dashboard isn't visual and scannable, people won't use it. Nobody's opening spreadsheets in 2024. Always bring context with your data. Numbers alone are pretty useless without telling people what to do next.
Honestly, just ignore those basic dashboard templates everyone uses - they're pretty useless. Start with what your company actually needs first. Diversity matters? Track demographic data and where you're sourcing from. Worried about budget? Focus on cost-per-hire stuff. Growing like crazy? Time-to-fill becomes your best friend. Most platforms let you drag widgets around once you poke through the settings (took me forever to figure that out). The whole trick is working backwards from your goals instead of just accepting whatever metrics they throw at you.
Honestly, you need to compare your hiring metrics to what other companies are doing - otherwise you're just guessing if you're good or terrible. Like, maybe your time-to-hire feels fast but everyone else is moving twice as quick, you know? It's kind of brutal but super useful for spotting where you're actually killing it vs. where you need help. Plus your boss will take you way more seriously when you come with real data asking for budget changes. Oh and grab benchmarks from HR associations or those recruiting reports - just make sure they match your company size and industry because tech startups obviously hire differently than banks.
So recruitment dashboards are basically your window into hiring patterns - when departments need people, what roles cost too much, all that stuff. I love seeing which job boards actually bring in good candidates versus the ones that are just money pits. The seasonal trends are super helpful for planning budgets ahead of time. You can spot if your cost-per-hire is getting crazy for certain positions. Honestly, having real data makes such a difference when you're asking for headcount. Way better than walking into meetings with just "we need more people" and hoping for the best, you know?
-
Great product with effective design. Helped a lot in our corporate presentations. Easy to edit and stunning visuals.
-
Unique research projects to present in meeting.
-
Editable templates with innovative design and color combination.
-
Illustrative design with editable content. Exceptional value for money. Highly pleased with the product.