


Kaizen planning implementing and controlling powerpoint presentation slides


Try Before you Buy Download Free Sample Product
 Impress Your
 Audience
Editable
of Time


If you wish to give an intuitive presentation on business change then our content-ready kaizen planning implementing and controlling PowerPoint presentation can give a complete makeover to your business slides. This predesigned Kaizen strategy PPT presentation includes slides on 5s framework, 4M checklist, types of wastes, kaizen vs innovation, the PDCA Cycle, reasons for unproductivity, action plan, competitor's analysis, lead time & cycle time, data collection & analysis, cause & effect analysis, Pareto analysis, evaluation of goals, standard operating sheet, kaizen before & after, scatter chart, stacked column chart, combo charts and line charts etc. These business improvement PowerPoint templates are apt to present various topics such as organization change, process excellence, product planning & control, project inception, quality management, cost reduction & avoidance, total productive maintenance, DMAIC, lean manufacturing, six sigma productivity improvement, and project implementation. Download this predesigned kaizen planning implementing and controlling PowerPoint template to present overall improvement in productivity. Ensure folks function with the desired commitment with our Kaizen Planning Implementing And Controlling Powerpoint Presentation Slides. Establish the correct intensity.
People who downloaded this PowerPoint presentation also viewed the following :
Content of this Powerpoint Presentation
Slide 1: This slide introduces Kaizen Planning , Implementing And Controlling. State Your Company Name and get started.
Slide 2: This is an Agenda slide. State your agendas here.
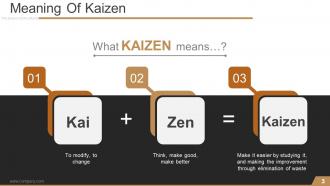
Slide 3: This slide states the Meaning Of Kaizen.
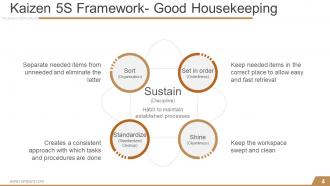
Slide 4: This slide shows Kaizen 5S Framework- Good Housekeeping with the following points- Sustain (Discipline), Sort (Organization), Set in order (Orderliness), Shine (Cleanliness), Standardize (Standardized Cleanup).
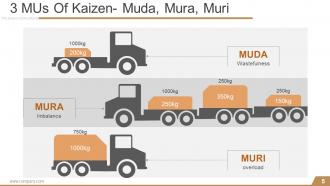
Slide 5: This slide presents 3 MUs Of Kaizen- Muda, Mura, Muri with relevant imagery.
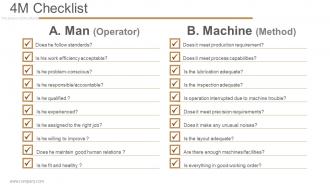
Slide 6: This slide shows 4M Checklist divdided into- 1.Man (Operator) Does the follow standards? Is his work efficiency acceptable? Is he problem-conscious? Is he responsible/accountable? Is he qualified ? Is he experienced? Is he assigned to the right job? Is he willing to improve ? Does he maintain good human relations ? Is he fit and healthy ? 2. Machine (Facilities): Does it meet production requirement? Does it meet process capabilities? Is the lubrication adequate? Is the inspection adequate? Is operation interrupted due to machine trouble? Dose it meet precision requirements? Does it make any unusual noises? Is the layout adequate? Are there enough machines/facilities? Is everything in good working order?
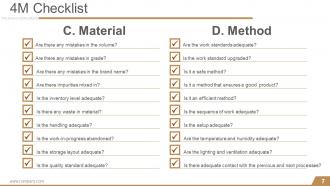
Slide 7: This slide shows 4M Checklist with- 3. Material: Are there any mistakes in the volume? Are there any mistakes in grade? Are there any mistakes in the brand name? Are there impurities mixed in? Is the inventory level adequate? Is there any waste in material? Is the handling adequate? Is the work-in-progress abandoned? Is the storage layout adequate? Is the quality standard adequate? 4. Method: Are the work standards adequate? Is the work standard upgraded? Is it a safe method? Is it a method that ensures a good product? Is it an efficient method? Is the sequence of work adequate? Is the setup adequate? Are the temperature and humidity adequate? Are the lighting and ventilation adequate? Is there adequate contact with the previous and next processes?
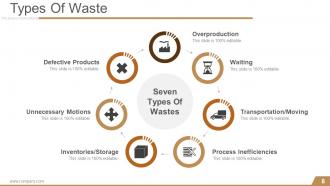
Slide 8: This slide showcases seven Types Of Waste. These are listed as- Overproduction, Waiting, Transportation/Moving, Process Inefficiencies, Inventories/Storage, Unnecessary Motions, Defective Products.
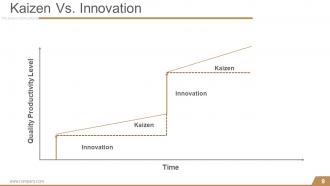
Slide 9: This is a Kaizen Vs. Innovation slide presented in a graphical form.
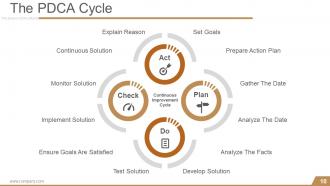
Slide 10: This slide presents The PDCA Cycle showing Continuous Improvement Cycle with- Explain Reason, Set Goals, Prepare Action Plan, Gather The Date, Analyze The Date, Analyze The Facts, Develop Solution, Test Solution, Ensure Goals Are Satisfied, Implement Solution, Monitor Solution, Continuous Solution, Continuous Improvement Cycle.
Slide 11: This is Problem And Statement slide with arrow imagery and text boxes.
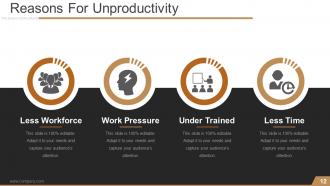
Slide 12: This slide presents a list of Reasons For Unproductivity- Less Workforce, Work Pressure, Under Trained, Less Time.
Slide 13: This is Our Goal slide with relevant imagery. State your goals here.
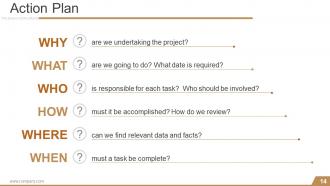
Slide 14: This is an Action Plan slide stating- WHY? are we undertaking the project? WHAT? are we going to do? What date is required? WHO? is responsible for each task? Who should be involved? HOW ? must it be accomplished? How do we review? WHERE? can we find relevant data and facts? WHEN? must a task be complete?
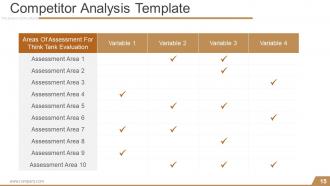
Slide 15: This slide presents Competitor Analysis Template to show the following 2 aspects- Areas Of Assessment For Think Tank Evaluation, Variable.
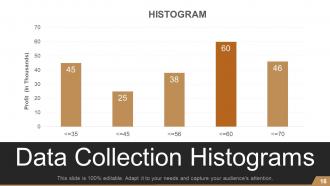
Slide 16: This slide showcases Data Collection Histograms. Use it as per your need.
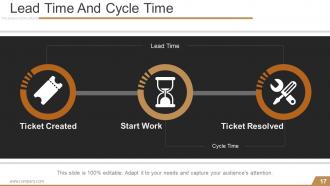
Slide 17: This is Lead Time And Cycle Time slide showing- Ticket Created, Ticket Resolved, Cycle Time, Lead Time, Start Work.
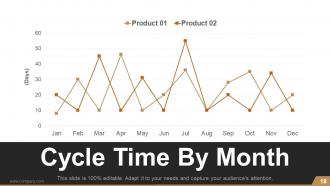
Slide 18: This slide presents Cycle Time By Month of Product 01 and Product 02 etc. graphically.
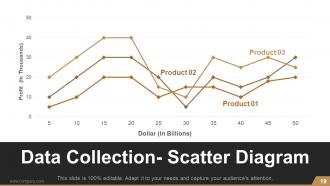
Slide 19: This slide presents Data Collection- Scatter Diagram of Product 01, Product 02, Product 03 etc.
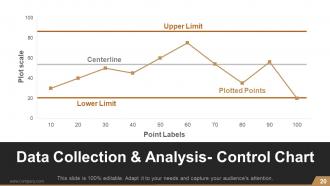
Slide 20: This slide presents Data Collection & Analysis- Control Chart to showcase- Centerline, Upper Limit, Plotted Points, Lower Limit.
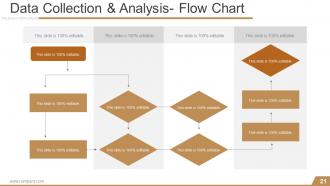
Slide 21: This slide shows Data Collection & Analysis- Flow Chart
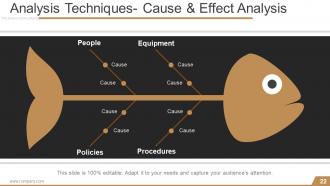
Slide 22: This slide presents Analysis Techniques- Cause & Effect Analysis in a fish bone diagram form to show- Cause, Equipment, Procedures, People, Policies.
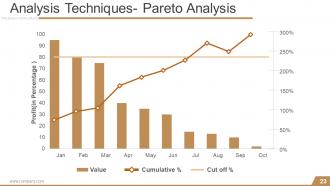
Slide 23: This slide shows Analysis Techniques- Pareto Analysis.
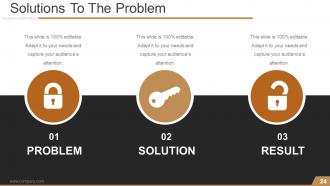
Slide 24: This is Solutions To The Problem slide to present- PROBLEM, SOLUTION, RESULT.
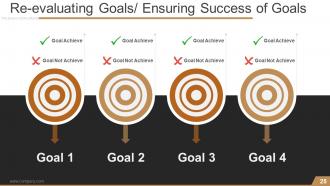
Slide 25: This is Re-evaluating Goals/ Ensuring Success of Goals slide with target imagery to show- Goal Achieve, Goal Not Achieve.
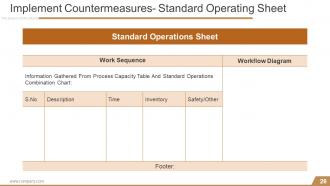
Slide 26: This slide presents Implement Countermeasures- Standard Operating Sheet.
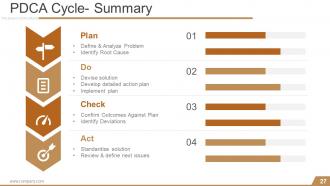
Slide 27: This slide presents PDCA Cycle- Summary with Plan, Do, Check and Act. Plan: Define & Analyze Problem, Identify Root Cause. Do: Devise solution, Develop detailed action plan, Implement plan. Check: Confirm Outcomes Against Plan, Identify Deviations / Issues. Act: Standardize solution, Review & define next issues.
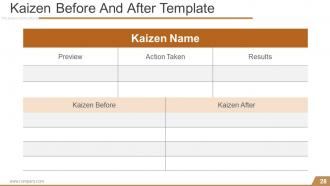
Slide 28: This slide presents Kaizen Before And After Template with Kaizen Name.
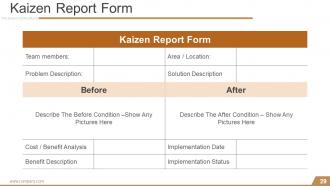
Slide 29: This slide showcases Kaizen Report Form to state.
Slide 30: This is a Coffee break image slide. You can alter the content as per need.
Slide 31: This slide showcases Bar Chart. Compare the products with this.
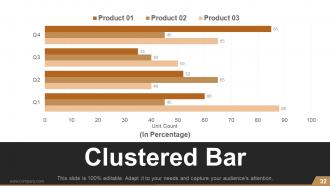
Slide 32: This is a Clustered Bar graph slide to show product/ entity comparison, specifications etc.
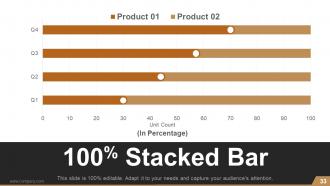
Slide 33: This is a 100% Stacked Bar slide to show product/ entity comparison, specifications etc.
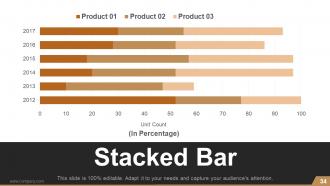
Slide 34: This is a Stacked Bar Chart slide to show product/entity growth, comparison, specifications etc.
Slide 35: This is a Pie Chart slide to show product/ entity comparison, specifications etc.
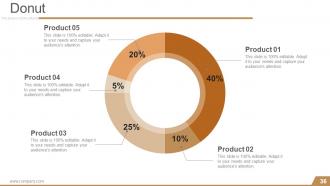
Slide 36: This is a Donut pie chart slide to present product/ entity comparison, specifications etc.
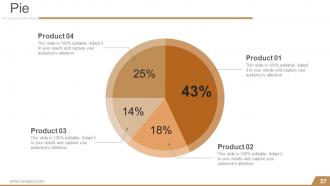
Slide 37: This is a Pie chart slide to present product/ entity comparison, specifications etc.
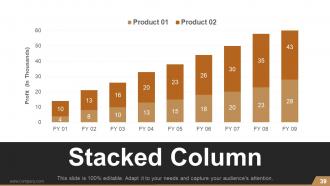
Slide 38: This slide is titled Stacked Column.
Slide 39: This is a Stacked Column graph slide to show product/ entity comparison, specifications etc.
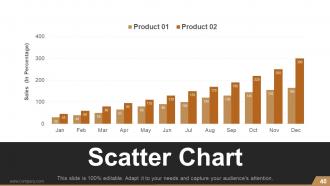
Slide 40: This is a Scatter Chart slide to present product/ entity comparison, specifications etc.
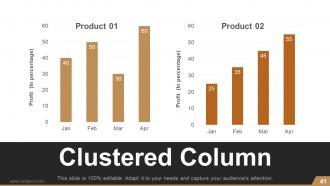
Slide 41: This is a Clustered Column slide to present product/ entity comparison, specifications etc.
Slide 42: This is a Stacked Area slide to present product/ entity comparison, specifications etc.
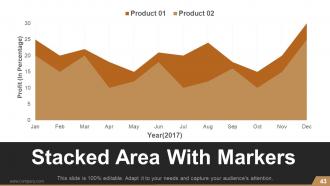
Slide 43: This slide presents Stacked Area With Markers to show product/ entity comparison, specifications etc.
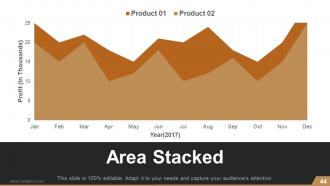
Slide 44: This is an Area Stacked slide to present product/ entity comparison, specifications etc.
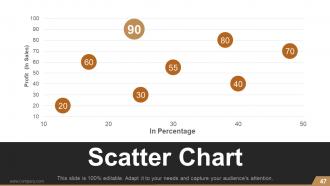
Slide 45: This slide is titled Scatter Chart.
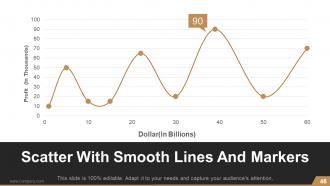
Slide 46: This is Scatter With Smooth Lines And Markers slide to present product/ entity comparison, specifications etc.
Slide 47: This is a Scatter Chart slide to present product/ entity comparison, specifications etc.
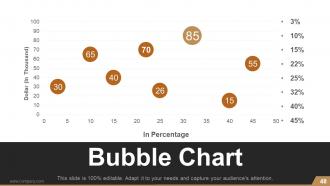
Slide 48: This is a Bubble Chart slide to show product/ entity comparison, specifications etc.
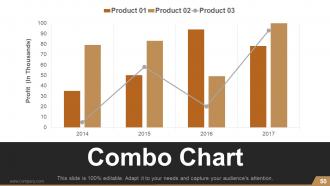
Slide 49: This slide is titled Combo Chart.
Slide 50: This is a Combo Chart slide to show information, comparison specifications etc.
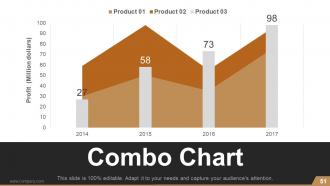
Slide 51: This is also a Combo Chart slide to show information, comparison specifications etc.
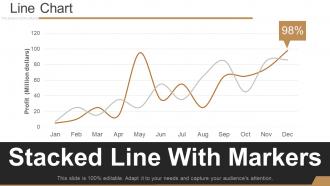
Slide 52: This slide is titled Line Chart.
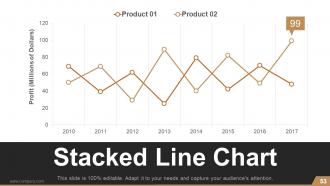
Slide 53: This slide presents Stacked Line Chart for showcasing product/ company growth, comparison etc.
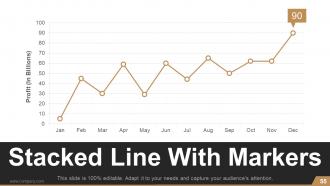
Slide 54: This slide presents Stacked Line With Markers for showcasing product/ company growth, comparison etc.
Slide 55: This slide also presents Stacked Line With Markers for showcasing product/ company growth, comparison etc.
Slide 56: This slide is titled Additional slide. Alter as per need.
Slide 57: This is Our Mission slide. State company mission here.
Slide 58: This is Meet Our Team slide with name and designation.
Slide 59: This is an About Us slide. State team/ company specifications here.
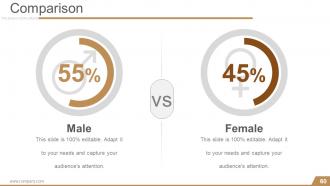
Slide 60: This is a Comparison slide for comparing entities/ products etc. here.
Slide 61: This is a Financial score slide. State financial aspects etc. here.
Slide 62: This is a Quotes slide to convey company messages, beliefs etc. You can change the slide contents as per need.
Slide 63: This is a Dashboard slide to state metrics, kpis etc.
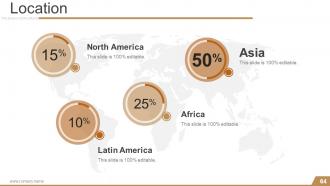
Slide 64: This is a Location slide on a world map image to show global presence, growth etc.
Slide 65: This is a Timeline slide to show evolution, growth, milestones etc.
Slide 66: This is also a Timeline slide to show evolution, growth, milestones etc.
Slide 67: This is another Timeline slide to show evolution, growth, milestones etc.
Slide 68: This slide showcases Post It Notes to be displayed. Show events, important piece of information, events etc. here.
Slide 69: This is a Puzzle pieces image slide to show information, specifications etc.
Slide 70: This is a Target image slide. State targets, etc. here.
Slide 71: This is a Circular image slide. State specifications, information here.
Slide 72: This is a Venn diagram image slide to show information, specifications etc.
Slide 73: This is a Mind map image slide to show information, specifications etc.
Slide 74: This is a Matrix slide to show information, specifications etc.
Slide 75: This is a LEGO slide with text boxes to show information.
Slide 76: This is a Hierarchy slide to show information, organization structural specifications etc.
Slide 77: This is a Bulb image slide to show information, innovative aspects etc.
Slide 78: This is a Magnifying glass image slide to show information, scoping aspects etc.
Slide 79: This is a Funnel image slide to show information, funneling aspects, specifications etc.
Slide 80: This is a Thank You slide with Address# street number, city, state, Contact Numbers, Email Address.
Kaizen planning implementing and controlling powerpoint presentation slides with all 80 slides:
Have great fun with our Kaizen Planning Implementing And Controlling Powerpoint Presentation Slides. Every event becomes enjoyable.


FAQs for Kaizen planning implementing and controlling
So Kaizen is all about making tiny improvements constantly instead of waiting for some massive overhaul. Get your whole team involved - honestly, the best ideas usually come from people actually doing the work daily. Have everyone spot wasteful stuff and test quick fixes. I'd start with regular improvement sessions where you review processes together. It's the total opposite of "don't fix what ain't broken" thinking! Try this: pick one annoying repetitive task this week and brainstorm how to make it even 5% smoother. Small changes add up fast.
Honestly, just make improvement everyone's thing, not just the bosses. Give your teams some basic training on problem-solving methods. Set aside like 30 minutes each week for people to spot issues and brainstorm fixes. Here's the key part - you've gotta actually listen and act on their good ideas fast. Nothing's worse than suggestions vanishing into thin air! Set up easy ways for people to share improvements. Celebrate the small wins publicly too. Let them try stuff without freaking out about failures. Start with one team first and watch it spread naturally.
Honestly, I'd go with Kaizen if I were you. Six Sigma is all about heavy statistical analysis and defect reduction - requires tons of training too. Lean cuts waste but it's pretty rigid. With Kaizen though, literally anyone can jump in with small improvements. Your regular employees become the stars instead of just management types. You could start with something as simple as a suggestion box tomorrow, no joke. Six Sigma needs those black belt certifications, Lean wants process mapping skills, but Kaizen doesn't gatekeep like that. Quick wins plus people actually feel heard? That's why I'd try it first.
Pick something small that's actually driving your team crazy - trust me, don't bite off more than you can chew at first. Round up the people who deal with it every day (not just managers) and carve out a couple days. Map what you're doing now before jumping to fixes. I can't tell you how many times I've watched teams skip this step and totally miss the obvious stuff. Test one change, see what happens, then move forward. Oh, and someone needs to own making it stick - schedule that follow-up for two weeks out or it'll just fade away.
Honestly, if your people aren't engaged, Kaizen's basically dead in the water. Your frontline workers are the ones spotting problems daily and actually implementing changes - without their buy-in, you'll just get people going through the motions. Maybe some passive-aggressive compliance if you're lucky. The whole thing depends on workers feeling empowered to speak up and take ownership of their processes. I've seen it work best when you ask for their input upfront and then actually use their suggestions. That builds real trust. Engaged employees become problem-solvers instead of just checking boxes.
Oh man, technology totally changes the game for Kaizen! Apps make it super easy to grab improvement ideas from your team instead of dealing with messy notebooks. Real-time dashboards are awesome for tracking metrics, plus you can do virtual gemba walks with video tools. AI actually finds process patterns that we'd probably miss - which is honestly pretty wild when you think about it. Remote teams can jump in through digital platforms too. But here's the thing: don't go crazy trying to digitize everything right away. Just pick one tool that fixes your biggest headache first.
Pick 2-3 metrics that actually matter to what you're trying to fix - cycle time, defect rates, cost savings, whatever. Before-and-after comparisons are your best friend here. I've watched teams get totally lost measuring every tiny thing (seriously, don't do that to yourself). Start collecting baseline data right now before you change anything, otherwise you'll be kicking yourself later. The real test? Check if your improvements stick around after 3-6 months. Most people forget that part but it's huge.
Get your team involved in spotting the actual problems they deal with every day - they'll care way more about fixes they helped identify. Small changes work better than massive overhauls that freak everyone out. Always explain why you're making changes and how it'll make their jobs easier. Some people will complain no matter what (there's always that one person, right?). Find the people who are excited about improvements first. When something works, make sure everyone hears about it. Your managers should be coaching people through changes, not just ordering them around. Quick wins are everything.
Don't try changing everything at once - that's the classic mistake. Focus on tiny improvements instead. Also, this stuff only works if your actual workers are on board. Making it some executive mandate from above? Total waste of time, honestly. You absolutely have to track what you're doing or you'll have no clue if anything's actually helping. Oh, and don't expect miracles overnight. Kaizen is more marathon than sprint. Pick one small thing your team already wants to fix and build from there.
Oh yeah, remote Kaizen is totally doable! I'd start with quick 15-minute check-ins where everyone mentions one tiny improvement they spotted or tried. Honestly, digital boards sometimes work better than physical ones since you can actually search old ideas later. Build it into meetings you already have - don't create new ones because that just feels like more work. Personal workflow tweaks are perfect for starting out. Once people get the hang of it (and aren't rolling their eyes), then you can expand to team stuff. The trick is keeping it casual, not making it another corporate thing to dread.
Toyota's basically the poster child for this - they created Kaizen and still use it everywhere. 3M cut their defects in half, Lockheed sped up aircraft production, and even Virginia Mason hospital improved patient safety with it. Honestly, it's kind of amazing how well it translates across industries. Whether you're building cars or treating people, the same principles work. My advice? Don't go crazy trying to fix everything at once. Just pick one process that's driving everyone nuts and focus on small daily tweaks. Way less overwhelming that way.
Look, you can't just tell people to do Kaizen and expect it to work. Walk around and actually talk to your team - ask what's bugging them or what could be better. When someone gives you a decent idea, do something with it! Nothing kills motivation faster than suggestions vanishing into thin air. Block out real time for improvement stuff, make a big deal when teams nail small wins. Oh, and clear roadblocks when they pop up - that's probably the most important part honestly. Pick one area to start with and get your hands dirty alongside everyone else. They'll see you're serious about it being the new normal, not just this month's flavor.
So with Kaizen, you're basically fixing all those annoying things that bug your customers - slow shipping, crappy products, weird service hiccups. They definitely notice when stuff runs smoother. Those tiny fixes really do add up too - less waste, better efficiency, fewer screw-ups. Happy customers don't leave and they tell their friends, which is money in your pocket. The cool part? It barely costs anything since you're just tweaking what you already do. I'd start simple - pick one customer journey, find three pain points that drive you nuts, and fix those first.
So basically Kaizen is all about getting your whole team to spot waste and fix it bit by bit. There's this thing called the "8 wastes" - overproduction, waiting around, too much inventory sitting there, pointless transportation between suppliers. Pretty comprehensive list honestly. Instead of bosses dictating changes from above, your frontline people become the ones finding problems and testing fixes on the spot. It builds this natural habit where everyone's always looking for ways to do things better. My advice? Map out your current supply chain first, then ask your team to point out one annoying waste they deal with daily. You'd be shocked what they'll catch that management misses completely.
So for Kaizen training, I'd probably start with Coursera or LinkedIn Learning - they've got some decent courses to get everyone on the same page first. ASQ certification is worth looking into if you want something more official. Once your team gets the basics down, bringing in a consultant for hands-on workshops is honestly where the magic happens. Oh, and definitely grab "Gemba Kaizen" by Masaaki Imai - it's like the bible for this stuff. Toyota's materials are incredible too since they basically created the whole approach. Start digital, then go hands-on is my take.
-
Use of icon with content is very relateable, informative and appealing.
-
Great quality product.