


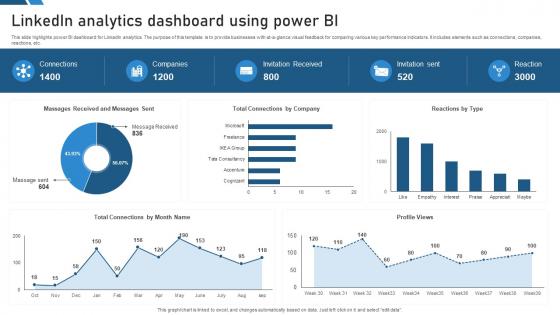
Linkedin Analytics Dashboard Using Power Bi




Try Before you Buy Download Free Sample Product
 Impress Your
 Audience
 100%
100% Editable
 Save Hours
 of Time


This slide highlights power BI dashboard for LinkedIn analytics. The purpose of this template is to provide businesses with at-a-glance visual feedback for comparing various key performance indicators. It includes elements such as connections, companies, reactions, etc.
People who downloaded this PowerPoint presentation also viewed the following :
Linkedin Analytics Dashboard Using Power Bi with all 10 slides:
Use our Linkedin Analytics Dashboard Using Power Bi to effectively help you save your valuable time. They are readymade to fit into any presentation structure.








FAQs for Linkedin Analytics Dashboard
Definitely track engagement rate and follower growth first - those show if people actually care about your stuff. Click-through rates are huge too since they tell you if you're driving real traffic. I used to get obsessed with vanity metrics like impressions but honestly? They're pretty useless for actual business results. Post reach and demographic insights are worth checking though - helps you figure out who's really paying attention to your content. Pull these numbers weekly and look for patterns in what performs best. Oh, and don't stress if some weeks look weird - social media can be random sometimes.
Dude, LinkedIn's engagement rates are insane compared to other platforms - like 2-5% vs Facebook's pathetic 0.09%. Makes total sense though. People scroll LinkedIn actually wanting professional stuff, so they'll engage with career/industry posts way more. Your B2B content will crush it there compared to Instagram or whatever. Only downside? Way smaller audience, obviously more niche. I'd just post less frequently but make each one count. Really play up that professional angle - that's your sweet spot for getting people to actually like and comment instead of just scrolling past.
Your LinkedIn follower data is honestly way better than just counting total followers - that's vanity metric stuff. You can see who's actually engaging: job titles, industries, company sizes, locations. Look for patterns you didn't expect. Maybe you're posting sales content but tons of HR directors are following you? That's a huge opportunity right there. Use this intel to create posts that hit your real audience's pain points. It's like having a cheat sheet for what content actually works. Way more useful than guessing what people want to hear.
LinkedIn Analytics is where you'll find the good stuff - see which posts your audience actually cares about. I'm always checking impressions (probably too much honestly). Look at engagement rates and click-throughs to figure out what's working. Maybe your carousel posts crush it while single images flop, or people share your industry takes but ignore the promotional stuff. Check your top 5 posts from last month and spot the patterns. Then just do more of whatever got people clicking and commenting. Demographics data helps too - sometimes you discover your audience isn't who you thought it was.
Dude, LinkedIn Live is seriously underrated for analytics. You get real-time viewer counts, watch time, comments - all while you're actually broadcasting. The post-event breakdown shows audience retention and when people tuned out (or got hooked). Live videos get about 7x more engagement than regular posts - I think LinkedIn just pushes them harder in feeds. You can see exactly who showed up and how long they stuck around. Oh, and those comment timestamps? Gold for figuring out what parts hit different. Use that stuff to plan your next content.
So company page analytics are all about how your business content is doing - follower demographics, engagement rates, visitor stats, that kind of thing. Your personal profile analytics are way more basic (and kinda disappointing tbh) - just profile views, search appearances, and how your individual posts perform. The cool thing about company pages is you can actually track leads and conversions if you're running ads. Personal profiles? Just networking data really. I'd check both weekly though. Different audiences respond to different stuff, so it's worth seeing what hits with each one.
Okay so impressions are basically how many times your post showed up in feeds. Engagement is the good stuff - likes, comments, shares, people actually doing something. I always think of impressions as "who saw it" and engagement as "who cared enough to react." If you're getting tons of impressions but nobody's engaging? Your content probably isn't hitting right. But when your engagement rate is solid compared to impressions, that means you're actually connecting with people. Honestly, I'd focus way more on engagement rate than impression numbers - it tells you if your LinkedIn game is actually working or if you're just... existing in the void.
So basically just post different versions of the same thing and see what happens! I'll test headlines one week, then maybe video vs carousel posts the next. LinkedIn Analytics shows all the good stuff - clicks, engagement, reach. Don't change everything at once though, you'll have no clue what actually moved the needle. Posting times matter way more than people think too. Give it like a week or two before checking your Company Page numbers. Once you find winners, just keep doing more of that. It's honestly pretty straightforward once you get into the rhythm.
Yeah, Google Analytics is your best bet to start - tracks what people do after clicking from LinkedIn to your site. Hootsuite and Buffer are solid for comparing LinkedIn against your other social platforms. LinkedIn's built-in analytics are honestly pretty meh on their own. HubSpot or Salesforce work great if you want to see which LinkedIn posts actually turn into real leads and sales (that's the good stuff). Oh, and definitely set up Google Analytics first if you haven't already - you're missing out on tons of data otherwise. Most people just look at likes and shares but ignore what happens next.
LinkedIn's Campaign Manager is where you'll set up conversion tracking - that's how you see which ads actually work. Cost per conversion shows up right there, so comparing ad spend to revenue is pretty straightforward. B2B attribution gets weird with longer sales cycles though, fair warning. I'd focus on cost per lead and how many leads turn into actual customers. Oh, and definitely use UTM parameters on your LinkedIn ads so you can follow people's whole journey in Google Analytics. Makes the data way cleaner.
Stop obsessing over views and impressions - they're vanity metrics that don't mean much. Different content types perform totally differently, so don't freak out when your text post doesn't hit video numbers. Context matters too: getting 100 likes with 500 followers is way better than with 50K followers, right? LinkedIn's analytics are slow (like 24-48 hours behind), so recent posts always look dead at first. I learned that the hard way lol. Focus on trends over weeks, not individual posts. Most importantly, tie everything back to what actually helps your business grow.
You can totally layer sentiment analysis over LinkedIn's regular analytics to see what people actually think about your posts. LinkedIn shows likes and comments, but sentiment tools tell you if those comments are genuinely positive or just polite corporate BS. Tools like Brandwatch or Hootsuite will scrape your mentions and analyze the emotional tone behind interactions. Way more useful than just counting reactions, honestly. I'd start by looking at your last month of posts to spot any patterns. It's pretty cool how much deeper you can dig into brand perception this way.
Check your analytics and post when your audience is actually online. If videos are crushing it compared to text posts, just do more videos - honestly, why fight what's already working? Look at your headline and bio too. Throw in some keywords you see other people in your space using successfully. Oh, and pay attention to which call-to-actions get people clicking on your profile or sending connection requests. Then steal that language (in a good way). Don't change everything at once though. One tweak per week so you'll know what's actually helping.
So I've been digging into LinkedIn Analytics for like a year now, and honestly the trick is just comparing your numbers month by month. Export everything to Excel though - LinkedIn's interface is kinda terrible for spotting patterns. I look at engagement rates, follower bumps, profile views, all that stuff. You'll start seeing when people actually pay attention vs when they're totally checked out. Holiday seasons are weird for B2B content, but industry conferences always spike things. Once you figure out your busy periods, just time your big campaigns around those peaks. Save your energy (and budget) when everyone's basically hibernating.
When your posts flop, try switching up the format - like turning text into a carousel or video. Look at what worked well before and steal those patterns for next time. Bad timing kills good content, so maybe repost when your followers are actually scrolling. I usually delete the real disasters if they're making my feed look sad. Oh and here's the thing - each bomb is basically free market research for what NOT to do again. Don't take it personally, just adjust and keep posting.
-
The templates are handy and I can personalize them as per my needs. Glad to be your subscriber!
-
I want to express my gratitude to SlideTeam’s presentation design services team for helping me create the best presentation of my life!