

Pdca Cycle In Quality Management And Problem Solving Powerpoint Presentation Slides




Try Before you Buy Download Free Sample Product
 Impress Your
 Audience
 100%
100% Editable
 Save Hours
 of Time


Represent your business four steps continuous improvement model using this content ready PDCA cycle in quality management and problem-solving PowerPoint presentation slides. The content of this presentation has been researched by research specialists and has been converted into an impactful presentation by a group of presentation designers at SlideTeam. This plan–do–check–act PPT presentation comprises of 59 slides that cover all the essential aspects of the PDCA cycle. The quality management and problem solving presentation PPT includes a slide on crucial topics such as agenda, meaning of KAIZEN, Kaizen 5s framework, 3Mus of Kaizen- MUDA, MURA, and MURI, 4M checklist, type of waste, Kaizen vs innovation, PDCA cycle, problem statement, reasons for unproductivity, our goal, action plan, data collection, lead time and cycle time, data collection and analysis control chart, analysis techniques-cause and effect analysis, solution to the problem, re-evaluating goals, implement countermeasures, and Kaizen report. You can use these business improvement cycle PowerPoint slides to elaborate the concept of lean manufacturing and quality assessment. Quickly download this stunning PDCA cycle in quality improvement presentation. Credibility of inputs is assured with our Pdca Cycle In Quality Management And Problem Solving Powerpoint Presentation Slides. Every bit of data is doubly certified.
People who downloaded this PowerPoint presentation also viewed the following :
Content of this Powerpoint Presentation
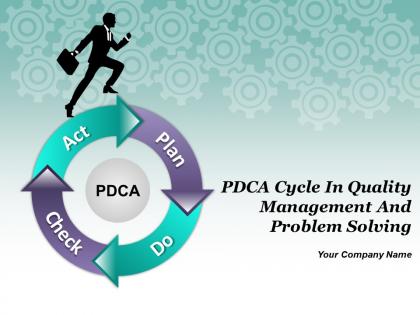
Slide 1: This slide introduces PDCA Cycle in Quality Management and Problem Solving. State Your Company Name and get started.
Slide 2: This slide showcases Agenda. You can add your agenda as per your company.
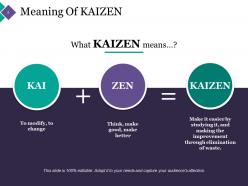
Slide 3: This slide shows Meaning Of KAIZEN. You can use it as per your requirement
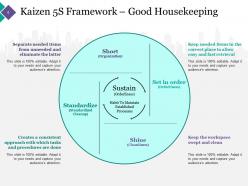
Slide 4: This slide present Kaizen 5S Framework – Good Housekeeping. You can use it as per your requirement.
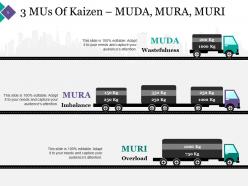
Slide 5: This slide showcases 3 MUs Of Kaizen – MUDA, MURA, MURI. Add as per your requirement.
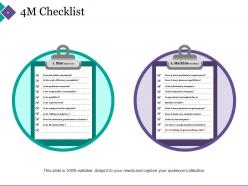
Slide 6: This slide shows 4M Checklist. Add your content in the slide and make the best use.
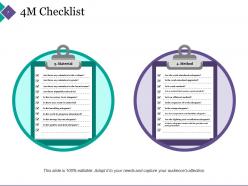
Slide 7: This slide showcases 4M Checklist. You can use it to add the material and method checklist.
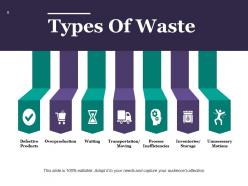
Slide 8: This slide presents Types Of Waste with these seven points to consider- Defective Products, Overproduction, Waiting, Transportation/Moving, Process Inefficiencies, Inventories/Storage, Unnecessary Motions.
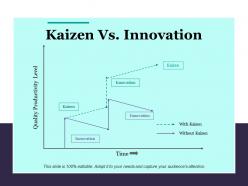
Slide 9: This slide is about Kaizen Vs. Innovation. Use this for the analysis of between these two.
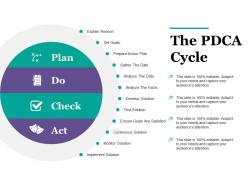
Slide 10: This slide presents The PDCA Cycle with these categories- Explain Reason, Continuous Solution, Monitor Solution, Implement Solution, Set Goals, Prepare Action Plan, Gather The Date, Analyze The Date, Analyze The Facts, Develop Solution, Test Solution, Ensure Goals Are Satisfied.
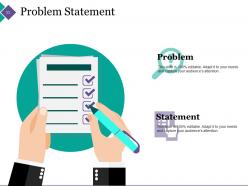
Slide 11: This slide presents Problem Statement with a these two you can describe- Problem, Statement.
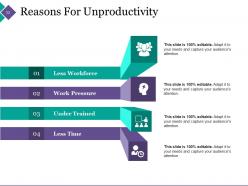
Slide 12: This slide showcases Reasons For Unproductivity with these four categories- Work Pressure, Less Time, Less Workforce, Under Trained.
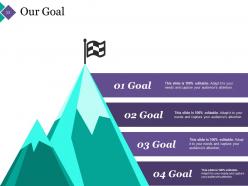
Slide 13: This slide presents Our Goal. You can add four goals in this and use it.
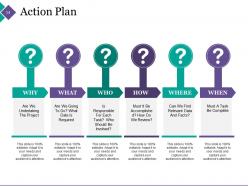
Slide 14: This slide showcases Action Plan. You can add your plan as you want.
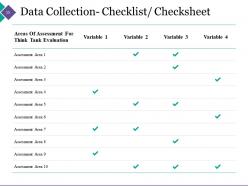
Slide 15: This slide present Data Collection- Checklist/ Checksheet. Add the information in the table and use it.
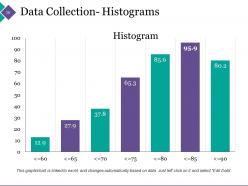
Slide 16: This slide shows Data Collection- Histograms. Use it accordingly or and add your data.
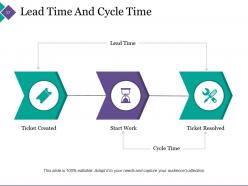
Slide 17: This slide displays Lead Time And Cycle Time with these steps to follow- Lead Time, Ticket Created, Ticket Resolved, Start Work, Cycle Time.
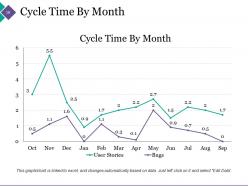
Slide 18: This slide showcase Cycle Time By Month graph. Add your own content and use it.
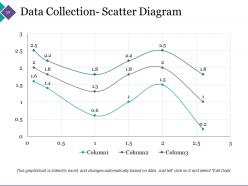
Slide 19: This slide presents Data Collection- Scatter Diagram. Use it as per your business needs.
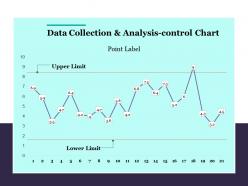
Slide 20: This slide presents Data Collection & Analysis-control Chart. Use this data analysis chart to analyse the conditions.
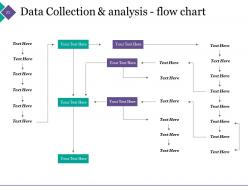
Slide 21: This slide showcases Data Collection & analysis - flow chart. Add your content in the flow chart and use it accordingly.
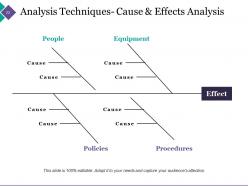
Slide 22: This slide presents Analysis Techniques- Cause & Effects Analysis with these points- Effect, Equipment, People, Procedures, Policies, Cause.
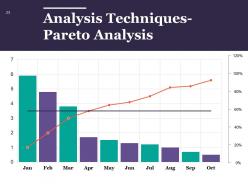
Slide 23: This slide presents Analysis Techniques- Pareto Analysis. Use this as per your need.
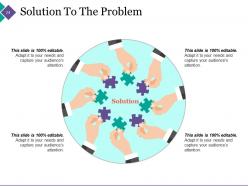
Slide 24: This slide showcases Solution To The Problem with an imagery.
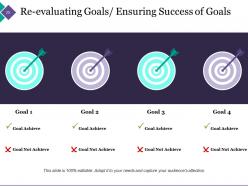
Slide 25: This slide shows Re-evaluating Goals/ Ensuring Success of Goals. You can add the goals in this slide as per you want.
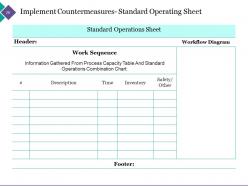
Slide 26: This slide presents Implement Countermeasures- Standard Operating Sheet. Add the content as per your need.
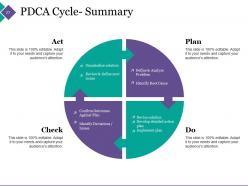
Slide 27: This slide shows PDCA Cycle- Summary with these several factors to consider- Define & Analyze Problem, Identify Root Cause, Devise solution, Develop detailed action plan, Implement plan, Confirm Outcomes Against Plan, Identify Deviations / Issues, Standardize solution, Review & define next issues.
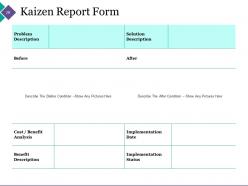
Slide 28: This slide presents Kaizen Report Form. With this you can use it to produce the short analysis summary.
Slide 29: This slide shows Coffee Break image.
Slide 30: This slide showcases PDCA Cycle In Quality Management Icon Slide
Slide 31: This slide displays the title Charts & Graphs.
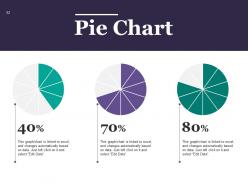
Slide 32: This slide presents pie chart. You can use it for your own product comparison.
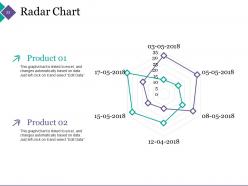
Slide 33: This slide presents a Radar Chart graph/chart. Compare Product 01, Product 02 and use as per required.
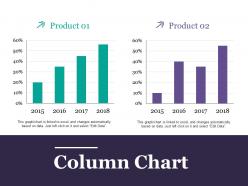
Slide 34: This slide shows Column Chart for comparison of the product.
Slide 35: This slide is titled Additional Slides.
Slide 36: This slide represents Our Mission. State your mission, goals etc.
Slide 37: This slide showcases Our Team with Name and Designation to fill.
Slide 38: This slide helps show- About Our Company. The sub headings include- Creative Design, Customer Care, Expand Company
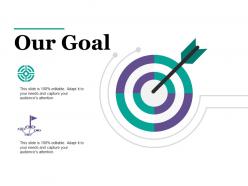
Slide 39: This slide shows Our Goals for your company.
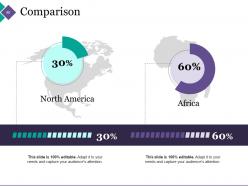
Slide 40: This slide showcases Comparison with the percentage comparison.
Slide 41: This is a Quotes slide to convey message, beliefs etc.
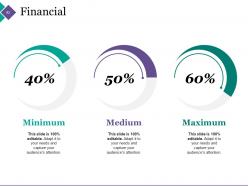
Slide 42: This slide is titled as Financials. Show finance related stuff here.
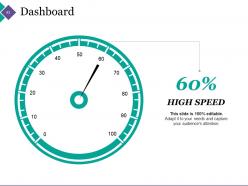
Slide 43: This is a Dashboard slide to show- Strategic System, Success, Goal Process, Sales Review, Communication Study.
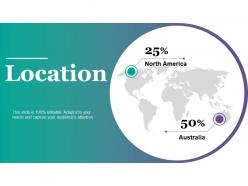
Slide 44: This is a Location slide to show global growth,presence etc. on world map.
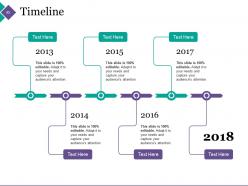
Slide 45: This is a Timelines slide to show- Plan, Budget, Schedule, Review.
Slide 46: This slide shows Target image with text boxes.
Slide 47: This slide is titled Community to show company news, events, highlights etc.
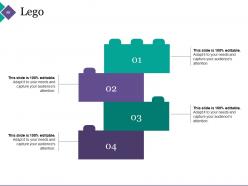
Slide 48: This is a Lego Box slide with the following subheadings- Teach, Encourage, Increase, Build.
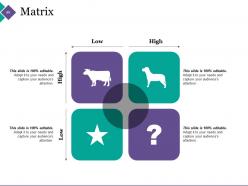
Slide 49: This slide showcases a Matrix with the following content- Development Clients, Dilemna Clients, Star Clients, High Value Clients.
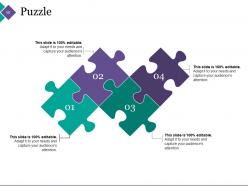
Slide 50: This slide showcases a Puzzle with imagery.
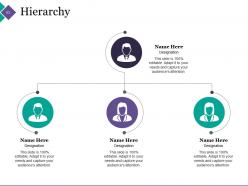
Slide 51: This slide is showing hirarchy.
Slide 52: This slide shows a Mind map for representing entities.
Slide 53: This is a Silhouettes image slide with the subheadings- INVENTORY, PAYMENT, CASH, CREDITCARD, CHECKOUT.
Slide 54: This is a Post It slide for reminders of Direct Marketing.
Slide 55: This is a Venn diagram image slide to show information, specifications etc.
Slide 56: This is a Bulb Or Idea image slide to show information, innovative aspects etc.
Slide 57: This is a Magnifying glass image slide to show information, scoping aspects etc.
Slide 58: This is a Funnel image slide showing: Calls-to-action, Reachability, User Experience, Color Schemes, Engagement, Simplicity.
Slide 59: This is a Thank You slide for acknowledgement.
Pdca Cycle In Quality Management And Problem Solving Powerpoint Presentation Slides with all 59 slides:
Deliberate on the facts that emerged with our Pdca Cycle In Quality Management And Problem Solving Powerpoint Presentation Slides. Highlight important instances.








FAQs for Pdca Cycle In Quality Management And Problem Solving
PDCA is just Plan, Do, Check, Act - four steps that loop back into each other. You identify a problem and map out your fix (Plan), test it small-scale first (Do), then see if it actually worked (Check). If it did, roll it out everywhere. If not, tweak and try again (Act). It's like the scientific method but for fixing stuff at work. Honestly, the whole thing clicked for me when I realized the "small scale" part is crucial - you don't want to blow up your entire process testing some half-baked idea. Each cycle feeds into the next one, so you're always getting better instead of just putting out fires.
Okay so for PDCA you basically need different metrics at each step. Start with Plan - track how well you're defining problems and setting realistic deadlines. Do is where teams usually mess up tbh, so monitor your milestones and resource usage closely. Check phase is straightforward - just compare what actually happened vs what you planned, use real numbers when you can. For Act, measure if you're actually sticking to the improvements long-term. Honestly though? Don't go crazy with data. Pick like 2-3 key things per stage max or you'll drown in spreadsheets. You can always add more later once you get the hang of it.
Dude, you absolutely have to get your team involved or the whole PDCA thing just won't work. Your employees are the ones actually doing the work - they know where stuff breaks down and can tell when fixes are actually helping. People hate changes that get dumped on them, but when they're part of planning and testing? They'll actually care about making it work. I learned this the hard way at my last job. Get input from everyone who touches the process. Don't just ask the managers - they're usually clueless about day-to-day issues anyway.
Totally! Just tweak the focus for whatever industry you're in. Manufacturing? Your "Check" phase is all about quality control numbers. Healthcare focuses more on patient outcomes instead. Tech companies actually run these cycles super fast - some teams I know do mini-PDCA rounds every week, which honestly makes sense for how quickly things move there. First step is mapping out your current processes to see where PDCA fits naturally. Then adjust your timeframes and what you're measuring based on your industry's speed. The planning phase should zero in on what actually matters in your sector, then you design tests around those specific things.
Honestly, the biggest mistake I see? People skip actually measuring their results after implementing changes - they just get excited and jump straight to the next thing. Makes total sense why it happens though. Organizations also love making these massive overhauls instead of testing small stuff first, which is backwards if you ask me. You'll learn way faster with quick experiments than waiting months for some huge rollout. Oh, and definitely don't plan changes without talking to the people who actually do the work daily. They know what's realistic and what isn't. Keep it small, track everything, involve your team.
PDCA is basically the scientific method for factories - you Plan a change, Do a small test, Check if it worked, then Act on what you learned. Each cycle builds on the previous one, so you're always improving instead of just putting out fires. Honestly, the simplicity is what makes it work so well. Your team tests stuff, learns from it, then either rolls it out or tries something different. I'd say pick one annoying process issue and run it through the whole cycle first - that way you'll see if it actually fits how your people work.
Oh totally! PDCA maps perfectly onto software development. Plan your sprint goals, Do the coding, Check with testing/reviews, then Act by deploying and taking feedback into the next round. Honestly, it's just agile with different labels - which isn't a bad thing since most teams are halfway doing this already anyway. Each sprint becomes its own little PDCA loop. Short cycles work best in my experience. Map out your current workflow first and see where each phase fits naturally. Don't overthink it though - the whole point is those quick feedback loops that keep you improving both the product and how you work.
Honestly, digital tools are a game-changer for PDCA cycles. Project management software helps track your Plan phase super cleanly. For the Check part, IoT sensors and analytics give you real-time monitoring - way better than manual tracking. Study gets faster with automated reporting (saves so much time). Cloud platforms make the Action phase smoother since everyone can actually see the same data instead of playing email tag forever. Though honestly? Don't overcomplicate it. Sometimes a good spreadsheet beats fancy software if that's what your team actually uses. Pick tools that fit how you already work, not the other way around.
PDCA's honestly perfect for small businesses - way better than just winging it with major changes. Plan something small, test it out, check if it actually worked, then do more of what's good. Two weeks is usually enough to see results. I mean, why risk blowing your budget on some huge overhaul when you can try stuff systematically? Pick whatever's annoying you most right now and run a quick pilot. You'll be shocked how much clearer things get when you're not just guessing what might work.
Oh man, Toyota's the classic case - they basically built their whole lean thing around PDCA cycles. Always tweaking stuff, testing changes, seeing what sticks. 3M does it for innovation too. Hospitals jumped on this for patient safety, which honestly makes total sense when you think about it. The thing is, successful companies don't treat it like some big formal project. They just... do it constantly. Super small scale works best - grab whatever process is driving your team nuts right now and cycle through it. You'll be surprised how much clearer things get when you actually follow the steps instead of just winging it.
Honestly, PDCA is so much easier than Six Sigma. You can start using it today on literally any problem - no training needed. Six Sigma? That's a whole certification process with tons of statistical analysis. Pretty overkill for most stuff. PDCA is just four simple steps you repeat quickly. Works for anything from fixing broken team meetings to customer service issues. Six Sigma's better for really complex, data-heavy problems where you need the rigorous approach. But for day-to-day stuff that's driving you crazy? PDCA's perfect. Pick something small that's bugging your team and try one cycle this week.
Honestly, start by explaining *why* you're doing PDCA - people hate change when they don't get the point. Get the skeptics involved in planning instead of fighting them. Keep your first cycles super small so you can show quick wins (nobody wants another endless corporate project, ugh). Train people properly and make a big deal about early successes. Don't brush off concerns - actually listen and respond. Maybe pick some influential team members as champions who can sell it to everyone else. The whole trick is making PDCA feel helpful rather than just more red tape from management.
PDCA and Agile are basically a perfect match - they both love that whole iterate-and-improve thing. Map it like this: Plan becomes sprint planning, Do is your actual dev work, Check covers demos and retros, then Act means you actually change stuff next sprint. Honestly, most decent Agile teams already do this without realizing it. The trick is making retros more structured by asking: what'd we plan, what really happened, what'd we learn, what needs fixing? Otherwise you end up with those whiny retro sessions that go nowhere. Just spend like 5-10 minutes each retro walking through PDCA steps. Makes your improvement efforts way less random.
So PDCA totally changes how you handle risk management - instead of just planning once and hoping for the best, you're constantly adjusting. Plan your responses, implement them, then actually check if they're working (not just assuming they are). Based on what you learn, you tweak and improve. Way more effective than those dusty risk registers everyone ignores! The cool part is you're always getting better at spotting risks as things change. Honestly, I'd start small though - just pick one big risk and walk it through the whole cycle first to get the hang of it.
So PDCA works great for schools - they just need to pick one problem and stick with it. Start with Planning: find something specific like low graduation rates and set clear goals. Do phase means rolling out your fix, maybe better tutoring or whatever. Then you Check the data - grades, student feedback, all that stuff. Most schools totally bail here and chase the next bright idea instead of finishing what they started. Act means you either keep what worked or tweak what didn't. The trick is actually completing the whole cycle before moving on to something else.
-
Awesome presentation, really professional and easy to edit.
-
Best Representation of topics, really appreciable.