


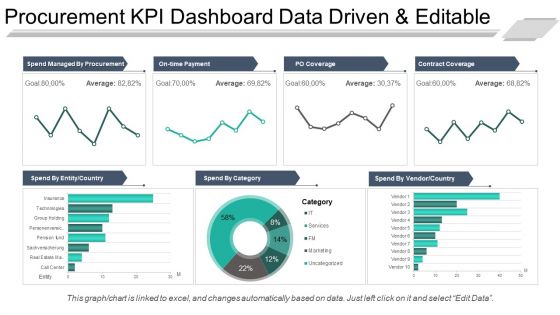
Procurement kpi dashboard snapshot data driven and editable ppt sample file





Try Before you Buy Download Free Sample Product
 Impress Your
 Audience
 100%
100% Editable
 Save Hours
 of Time


Instruct the delegates with our Procurement Kpi Dashboard Snapshot Data Driven And Editable Ppt Sample File. Acquaint them with the forthcoming agenda.
People who downloaded this PowerPoint presentation also viewed the following :
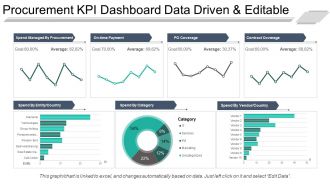
Procurement kpi dashboard snapshot data driven and editable ppt sample file with all 5 slides:
Cook up a delectable dish with our Procurement Kpi Dashboard Snapshot Data Driven And Editable Ppt Sample File. They are like a gastronomic delight.

FAQs for Procurement kpi dashboard snapshot data driven and editable
Focus on the big four: cost, quality, speed, and how well your suppliers actually perform. Cost savings percentage and spend under management are solid starts - executives love those numbers. Procurement cycle time matters too, along with supplier delivery rates and defect metrics. Honestly, supplier diversity stats can be a real win if your company cares about that stuff. Don't forget risk indicators like supplier financial health. Single-source dependencies will bite you eventually. Keep it under 10 metrics though, or people just tune out. Pick what actually moves the needle for decisions.
So basically you get this real-time view of how your suppliers are doing - who's always late, going over budget, that kind of stuff. Makes sourcing decisions way easier when you can actually see the patterns. No more drowning in spreadsheets (thank god). The best part? You'll have actual numbers when you're negotiating contracts instead of just guessing. You can pit suppliers against each other too and track your savings. Oh, and don't try to track everything at once - pick maybe 3 or 4 metrics to start or you'll go crazy.
Start with your most critical metrics - don't try to show everything at once. Color coding helps (red = bad, green = good) but honestly, I've seen dashboards that look like a casino exploded. Keep it to maybe 5-7 KPIs max per screen. Bar charts and line graphs work way better than fancy stuff that nobody understands. Set up auto-refresh so you're not manually updating all the time - that's just painful. Think about who's actually using this thing. Your executives want the 30,000-foot view while buyers need to dig into specific suppliers and categories.
Look, automation is a game changer here - it pulls data straight from your ERP and supplier systems without you having to mess around in Excel all day. Real-time updates happen automatically, which honestly saves so much headache. AI can catch weird spending patterns before they blow up too. Mobile access is clutch since you're not stuck at your computer. Oh, and machine learning flags issues early. Just don't try to integrate everything at once - pick one system first and build from there. Way less overwhelming that way.
So spend analysis is basically the foundation of your whole procurement dashboard - it shows where your money's actually going. You can track spend by category, supplier concentration, maverick buying, all that stuff. Honestly, it's pretty shocking when you first see how scattered everything really is! The data helps you spot trends and risks you never knew existed. Without it, your other KPIs don't mean much. Oh, and focus on your top 80% of spend first - that's where you'll see real impact. Trust me, start there and work down.
Honestly, just connect your procurement stuff to what executives actually lose sleep over - revenue, costs, risk, you know? Skip the basic metrics like "supplier count" - that's meaningless. Focus on things like cost savings as a percentage of revenue or how supplier issues mess with product quality. Talk to other department heads regularly (this part's actually kind of fun once you get into it) and figure out their biggest headaches. Then build your dashboard around showing how you're fixing those specific problems. I'd start with maybe 3 or 4 solid KPIs that clearly tie back to real business results. Way more effective than random tracking.
Ugh, data quality will be your worst enemy - it's always messier than you think. Getting stakeholders aligned on metrics is brutal too since everyone wants to track different stuff. Your procurement data's probably living in like 5 different systems, which makes consolidating everything a total headache. Then you gotta build dashboards that don't suck but still show everything people need. Honestly, just pick 5-6 metrics everyone can actually agree on first. Once you prove it works and fix your data mess, then you can get fancy with more complex stuff.
Honestly, real-time data changes everything for procurement dashboards. You're not stuck looking at last week's numbers anymore - you can actually catch supplier delays or budget issues while they're happening. The teams I've worked with? They're finding problems in hours, not days, which is pretty game-changing. Your spend patterns and contract compliance stuff updates automatically, so you've got fresh visibility constantly. Just set up alerts for the big thresholds though - otherwise you'll go crazy watching numbers bounce around all day. Way better than those old static reports that told you what already went wrong.
Honestly, depends on your budget and what you're already working with. Power BI and Tableau are amazing but they'll cost you - only worth it if your company's already invested. Google Data Studio won't cost anything and does more than you'd expect. Half the procurement teams I know are still living in Excel anyway, so just build something there with pivot tables if that's your reality. Qlik Sense is solid too. Python folks can go nuts building custom stuff, but that's probably overkill. My advice? Start simple with whatever your team actually knows how to use. Beautiful dashboards don't matter if nobody opens them.
Check your operational stuff like spend variance monthly - that's frequent enough to catch issues early. Strategic KPIs though? Quarterly works better for those. I've watched teams obsess over daily checks and honestly it just creates unnecessary stress. Your dashboard should update automatically anyway. The actual KPI definitions need a yearly refresh, or whenever your strategy changes (which let's be real, happens more than we'd like). Most important thing is staying consistent with timing so you can actually spot trends. Set those calendar reminders now before you forget!
So operational KPIs are your daily stuff - how fast you process purchase orders, whether suppliers deliver on time, invoice turnaround times. Strategic ones are the big wins like total cost savings, supplier relationships, risk management across your whole supply chain. Most dashboards try cramming everything together and it's a mess, honestly. Your team needs those operational numbers every day to catch problems early. But when you're presenting to executives? They want to see strategic impact over months, not daily cycle times. I'd build two separate views. Way cleaner that way.
Track stuff like on-time delivery, quality scores, and cost variance - those tell you what's actually happening. Color-coded scorecards work great for quick checks. Traffic light systems are clutch (red/yellow/green). Also add supplier risk indicators because surprises from key vendors are the worst. Honestly, I'd do a simple ranking table too. Keep the whole thing straightforward enough that your team can scan it during reviews. Nobody wants to dig through tons of data just to figure out if a supplier is screwing up.
So here's the thing - category management is a total game changer for procurement. You basically group similar spending together and put someone in charge of each category. Sounds simple, right? But the results are crazy good. We're talking 10-15% cost savings on average, plus your suppliers actually start performing better and following contracts. Cycle times get faster, relationships improve, everything just clicks. I'd start with your biggest 3 spend areas first - honestly wish we'd done this years ago. You'll see the difference within a few months, guaranteed.
Honestly, dashboards are lifesavers for this stuff. Everyone gets the same view of what's happening, so you're not constantly answering random questions or scrambling for reports. Your execs can just check spend analytics and supplier performance themselves instead of bugging you every week. Those steering committee meetings become way smoother - no more awkward "I'll circle back on that" moments. Real-time contract status, automated alerts for the important thresholds... it basically runs itself once you set it up. You'll actually have time to fix problems instead of just reporting on them constantly. Trust me, it's worth the initial setup headache.
Honestly, predictive analytics is where it's at right now - dashboards that actually forecast supplier risks instead of just showing you what already went wrong. ESG scoring is everywhere too since everyone's obsessed with sustainability metrics these days. Natural language processing for contract analysis is pretty cool, automatically picks apart terms so you don't have to. Mobile design is finally catching up because nobody wants to be stuck at their desk all day. There's also real-time spend intelligence but that's getting into the weeds. Start with predictive stuff though - you'll actually see your decision-making speed improve big time.
-
The content is very helpful from business point of view.
-
Design layout is very impressive.