


Project management life cycle methodology powerpoint presentation slides





Try Before you Buy Download Free Sample Product
 Impress Your
 Audience
 100%
100% Editable
 Save Hours
 of Time


Need to present a project plan then our content-ready project management life cycle methodology PowerPoint presentation will tell you how to do it. It takes you through the program lifecycle step by step. The product management PowerPoint template contains all the slides you need for business planning such as planning process, dimensions of planning, elements of lifecycle , objectives, scope, lifecycle phases, critical path method, business planner, activity planning chart, week scheduler, yearly scheduler, project tasks status dashboard, work breakdown structure, stages of business planning, work process, business team performance, timeline, schedule, potential delays in execution, risk identification, progress against baseline schedule, alternatives evaluation and budgeting etc. By using our product development PPT slides, you can showcase topics such as project portfolio, control system, product based planning, process-based system, phased approach, system development lifecycle, task management and business strategy. Download this project management life cycle methodology PPT graphics to create an effective business presentation. Enthuse them with our project management ppt Slides. Break through the initial diffidence.
People who downloaded this PowerPoint presentation also viewed the following :
Content of this Powerpoint Presentation
Slide 1: This slide introduces Project Management Life Cycle Methodology. State Your Company Name and begin.
Slide 2: This is an Agenda slide. Present your agendas here.
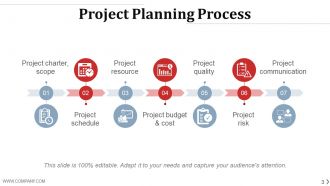
Slide 3: This slide showcases Project Planning Process displaying- Project communication, Project schedule, Project resource, Project quality, Project budget & cost, Project risk, Project charter, scope.
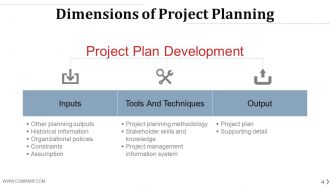
Slide 4: This slide presents Dimensions of Project Planning with the subheading Project Plan Development divided into three parts- Inputs, Output, Tools And Techniques.
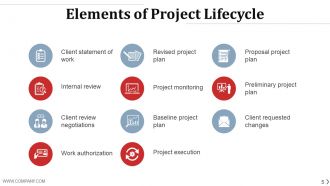
Slide 5: This slide showcases the Elements Of Project Life Cycle with the following constituents- Preliminary Project Plan, Proposal Project Plan, Baseline Project Plan, Project Execution, Client Requested Changes, Client Statement Of Work, Internal Review, Client Review Negotiations, Work Authorization, Project Monitoring, Revised Project Plan.
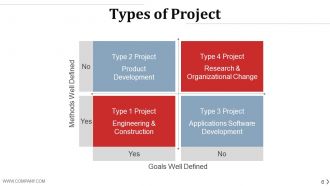
Slide 6: This is a Matrix slide for Types of Project in terms of- Methods Well Defined, Goals Well Defined.
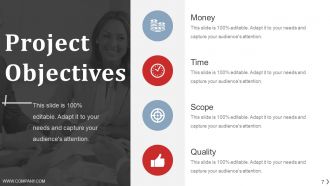
Slide 7: This slide presents Project Objectives listed in terms of- Money, Time, Scope, Quality.
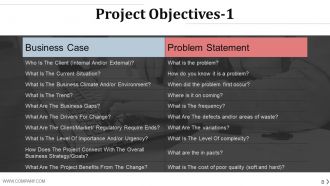
Slide 8: This slide also presents Project Objectives listed differently as Business Case and Problem Statement.
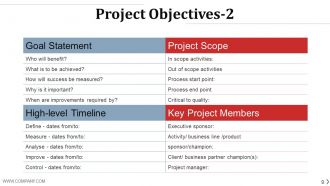
Slide 9: This slide also presents Project Objectives listed as Goal Statement, Project Scope, High-level Timeline and Key Project Members.
Slide 10: This slide showcases Project Scope including the following points- Project Justification, Project Objectives, Project Scope Description, Project Acceptance Criteria, Project Constraints, Project Assumptions.
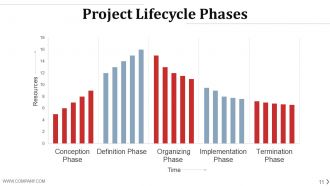
Slide 11: This slide shows the different Project Lifecycle Phases- Conception Phase, Definition Phase, Programming / Organizing Phase, Implementation Phase, Termination Phase.
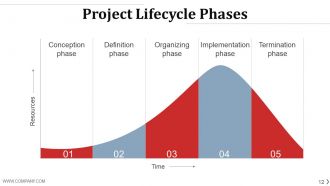
Slide 12: This slide shows the different Project Lifecycle Phases- Conception Phase, Definition Phase, Programming / Organizing Phase, Implementation Phase, Termination Phase.
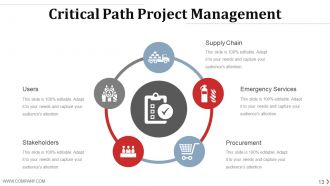
Slide 13: This slide showcases Critical Path Project Management showing- Users, Supply Chain, Emergency Services, Procurement, Stakeholders.
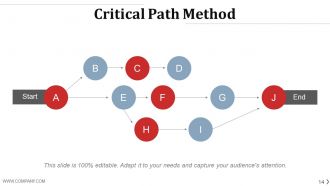
Slide 14: This slide is a diagrammatic presentation of Critical Path Method.
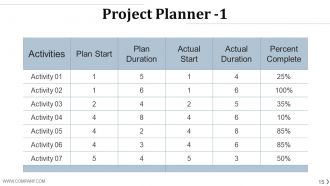
Slide 15: This slide displays a Project Planner table. Plan, Act or make important decisions using this slide.
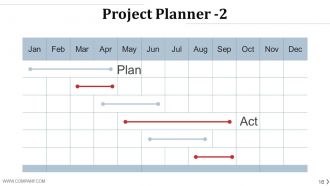
Slide 16: This slide displays a Project Planner. Plan, Act or make important decisions using this slide.
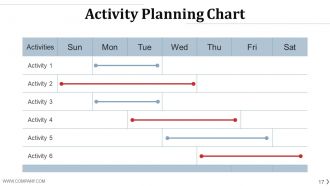
Slide 17: This slide displays Activity Planning Chart. Plan, Act or make important decisions using this slide.
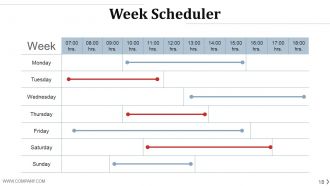
Slide 18: This slide presents a Week Scheduler. Show weekly plans or make important decisions using this slide.
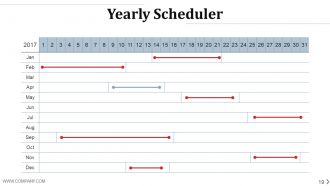
Slide 19: This slide presents a Yearly Scheduler. Show yearly plans or make important decisions using this slide.
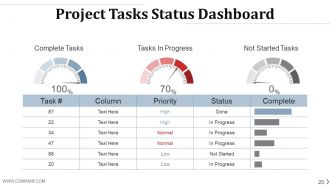
Slide 20: This slide presents a Project Tasks Status Dashboard showing- Complete Tasks, Tasks In Progress, Not Started Tasks.
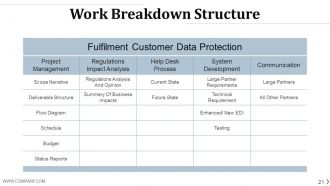
Slide 21: This slide showcase a Work Breakdown Structure.
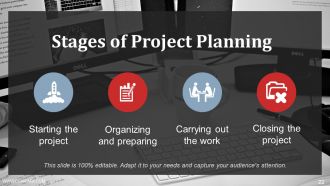
Slide 22: This slide shows Stages Of Project Planning. The listed stages are- Starting the Project, Organizing and Preparing, Carrying out the Work, Closing the Project.
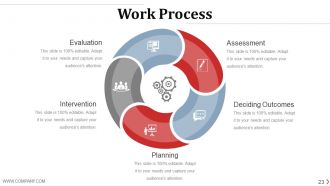
Slide 23: This slide shows Work Process displaying- Assessment, Evaluation, Deciding Outcomes, Intervention, Planning.
Slide 24: This slide shows Project Team Management.
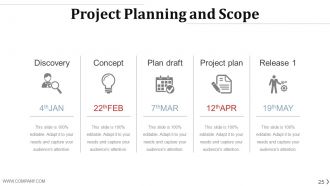
Slide 25: This slide shows Project Planning And Scope in terms of months. The constituents are- Discovery, Concept, Reference, Plan draft, Project plan.
Slide 26: This is a Coffee Break image slide. You may alter/change the slide content as per need.
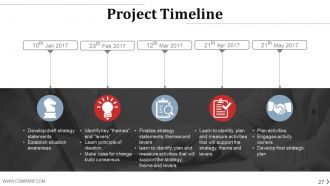
Slide 27: This slide presents a Project Timeline. State important milestones here.
Slide 28: This slide displays a Project Schedule in terms of months.
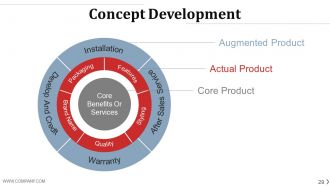
Slide 29: This slide presents Concept Development with the following constituents- Installation, Packaging, Features, Brand Name, Quality, Styling, Develop And Credit, After Sales Service, Core Benefits Or Services, Core Product, Augmented Product, Actual Product.
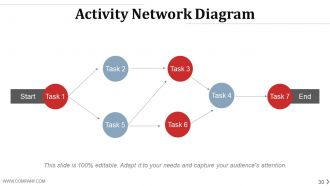
Slide 30: This slide shows an Activity Network Diagram. Show your tasks' start and end point here.
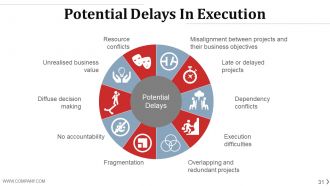
Slide 31: This slide displays Potential Delays In Execution. The listed points are- Misalignment Between Projects And Their Business Objectives, Late Or Delayed Projects, Dependency Conflicts, Execution Difficulties, Overlapping And Redundant Projects, Unrealised Business Value, Diffuse Decision Making, No Accountability, Fragmentation, Resource Conflicts.
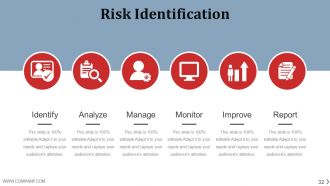
Slide 32: This slide presents Risk Identification with the following subheadings- Identify (What Risk Do We Have ?) Monitor (Manage Accountability), Analyze (What Are The Impacts?), Manage (Define The Steps), Improve (Streamline & The Process), Report (Ensure Performance & Visibility).
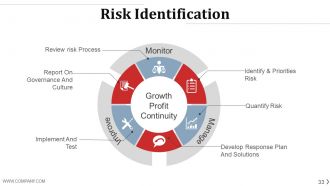
Slide 33: This slide showcases Risk Identification in terms of Monitor, Manage and Improve. The points listed are- Review risk Process, Identify & Priorities Risk, Quantify Risk, Develop Response Plan And Solutions, Implement And Test, Report On Governance And Culture, Growth Profit Continuity.
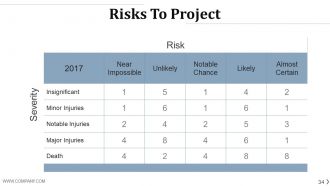
Slide 34: This slide presents a Risks To Project Matrix.
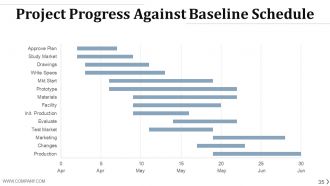
Slide 35: This slide presents Project Progress Against Baseline Schedule in Gantt chart form.
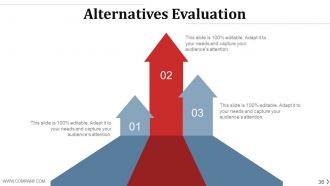
Slide 36: This slide presents Alternatives Evalaution for the project.
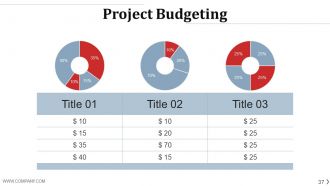
Slide 37: This slide showcases Project Budgeting in Pie Chart form.
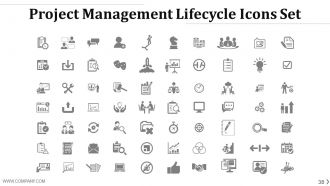
Slide 38: This slide shows Project Management Lifecycle Icons Set. Use the icons as per need.
Slide 39: This slide is titled Additional slides for moving forward. You may change the content as per need.
Slide 40: This is an About Us slide. State company/team specifications here.
Slide 41: This is Our Mission slide with target icon imagery. State it here.
Slide 42: This is Our Goal slide. State targets, goals here.
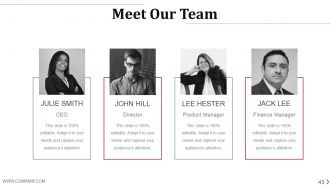
Slide 43: This is Meet Our team slide with name, designation and text boxes to state information.
Slide 44: This is a Financials score slide. State financial aspects, reports, results etc. here.
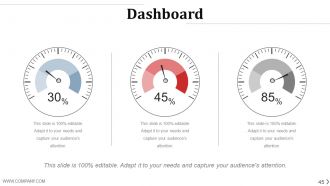
Slide 45: This is a Dashboard slide to state Low, medium and High aspects, kpis, metrics etc.
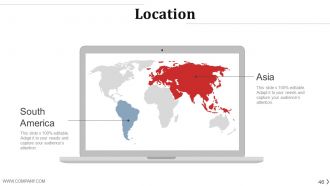
Slide 46: This is a Locations slide to show global segragation, presence etc. on a world map and text boxes to make it explicit.
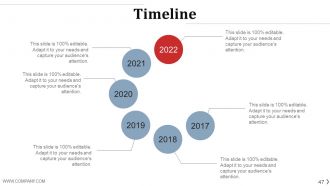
Slide 47: This is a Timeline slide to present important dates, milestones etc.
Slide 48: This is Important Notes slide. Post your notes here.
Slide 49: This is a Newspaper slide to add memorabilia or important pointers.
Slide 50: This is a Puzzle image slide. State specifications, information here.
Slide 51: This is a Target slide. State your targets here.
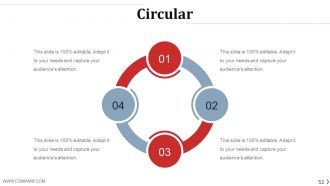
Slide 52: This is a Circular image slide. State specifications, information here.
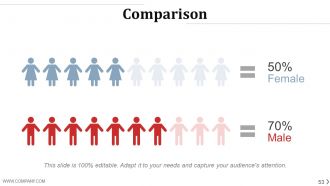
Slide 53: This is a Comparison slide to show comparison, information, specifications etc.
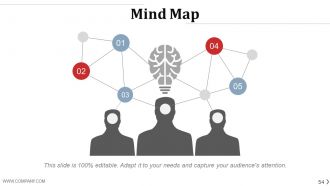
Slide 54: This is a Mind Map image slide to show information, segregation, specifications etc.
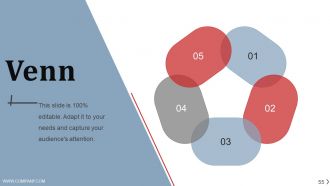
Slide 55: This is a Venn diagram slide to show information, specifications etc.
Slide 56: This is a Lego image slide to show information, specifications etc.
Slide 57: This slide shows Silhouettes with text boxes. State people related information, specifications etc. here.
Slide 58: This is a Hierarchy slide. State team/department, organization information, specifications etc. here.
Slide 59: This is a Generate Idea image slide in human brain bulb form to show ideas, innovative information etc.
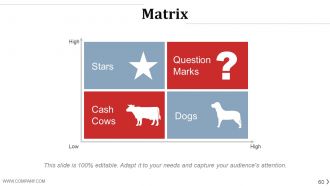
Slide 60: This is a Matrix slide. Put relevant comparison data here.
Slide 61: This is a Magnifying Glass image slide to show information, specifications etc.
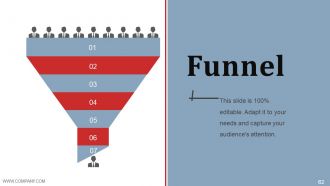
Slide 62: This is a Funnel slide. Showcase the funneling aspect of your team, company, product etc.
Slide 63: This slide is titled Our Charts. You can change the slide content as per need.
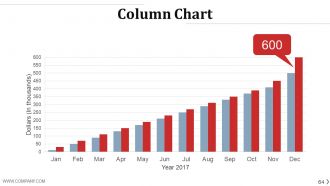
Slide 64: This is a Column Chart slide to show product/entity growth, comparison, specifications etc.
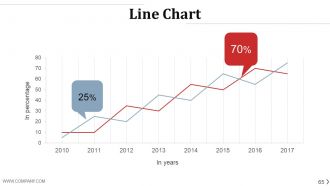
Slide 65: This is a Line Chart slide to show product/entity growth, comparison, specifications etc.
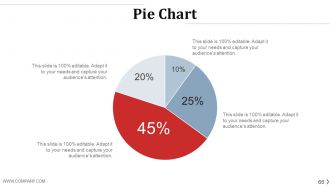
Slide 66: This is a Pie Chart slide to show product/entity growth, comparison, specifications etc.
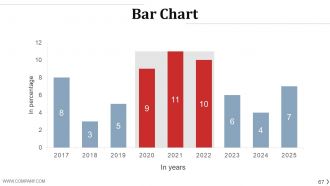
Slide 67: This is a Bar Chart slide to show product/entity growth, comparison, specifications etc.
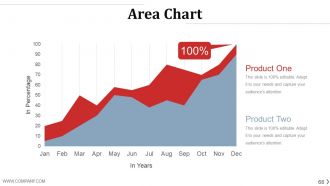
Slide 68: This is an Area Chart slide to show product/entity growth, comparison, specifications etc.
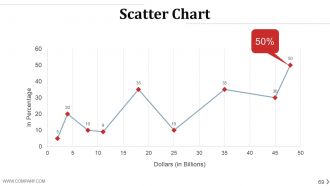
Slide 69: This is a Scatter Chart slide to show product/entity growth, comparison, specifications etc.
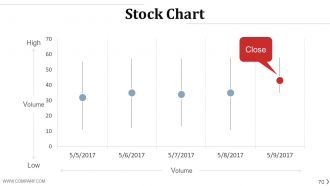
Slide 70: This is a Stock Chart slide to show product/entity growth, comparison, specifications etc.
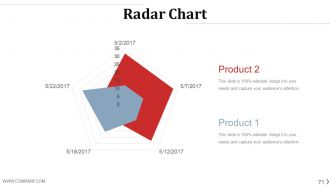
Slide 71: This is a Radar Chart slide to show product/entity growth, comparison, specifications etc.
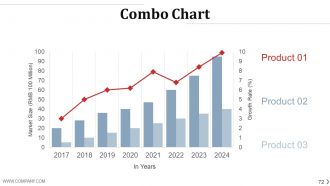
Slide 72: This is a Combo Chart slide to show product/entity growth, comparison, specifications etc.
Slide 73: This is a Contact Us slide with Address# street number, city, state, Contact Number, Email Address.
Slide 74: This is a Thank You slide for acknowledgement or to end a presentation.
Project management life cycle methodology powerpoint presentation slides with all 74 slides:
Demonstrate your capacity for dynamic action with our Project Management Life Cycle Methodology Powerpoint Presentation Slides. Bring your desire for growth to the fore.
-
Project Management Life Cycle Methodology
-
Agenda Slide
-
Project Planning Process
-
Dimensions of Project Planning
-
Elements of Project Lifecycle
-
Types of Project
-
Project Objectives
-
Project Objectives 1
-
Project Objectives 2
-

Project Scope
-
Project Lifecycle Phases
-
Project Lifecycle Phases
-
Critical Path Project Management
-
Critical Path Method
-
Project Planner 1
-
Project Planner 2
-
Activity Planning Chart
-
Week Scheduler
-
Yearly Scheduler
-
Project Tasks Status Dashboard
-
Work Breakdown Structure
-
Stages of Project Planning
-
Work Process
-
Project Team Management
-
Project Planning and Scope
-
Coffee Break
-
Project Timeline
-

Project Schedule
-
Concept Development
-
Activity Network Diagram
-
Potential Delays In Execution
-
Risk Identification
-
Risk Identification
-
Risks To Project
-
Project Progress Against Baseline Schedule
-
Alternatives Evaluation
-
Project Budgeting
-
Project Management Lifecycle Icons Set
-

Additional Slides
-
About Us
-
Our Mission
-
Our Goal
-
Meet Our Team
-

Financial
-
Dashboard
-
Location
-
Timeline
-
Important Notes
-
News Paper
-
Puzzle
-
Target
-
Circular
-
Comparison
-
Mind Map
-
Venn
-
Lego
-
Silhouettes
-

Hierarchy
-
Generate Idea
-
Matrix
-

Magnifying Glass
-
Funnel
-
Our Charts
-
Column Chart
-
Line Chart
-
Pie Chart
-
Bar Chart
-
Area Chart
-
Scatter Chart
-
Stock Chart
-
Radar Chart
-
Combo Chart
-

Contact Us
-

Thank You
FAQs for Project management life cycle methodology
So basically there's five main phases - Initiation, Planning, Execution, Monitoring & Controlling, and Closing. They're supposed to go in order but honestly they blend together a lot. Initiation is where you figure out what you're actually trying to do and set your scope. Planning gets into the weeds with timelines, resources, all that detailed stuff. Then Execution is the fun part where stuff actually gets built! Monitoring happens alongside everything to catch problems before they blow up. Here's the thing though - you'll constantly bounce between phases when reality hits your perfect plan. Nothing ever goes exactly as planned anyway.
Get everyone in a room first and hammer out exactly what you're building. Document everything - deliverables, what's NOT included, success metrics. Trust me, projects die when people assume stuff that was never agreed on. Be crazy specific about what you're delivering, then make it crystal clear what's off limits. Honestly, the "what we're NOT doing" part is almost more important. Get signatures on everything upfront. Oh, and set up a change request process immediately because people will come out of the woodwork with "quick additions" otherwise.
Honestly, stakeholder analysis is a lifesaver in planning. You map out everyone who could impact your project - sponsors, users, that one department head who always complains. Figure out their power levels and what they actually want upfront. Trust me, it beats having someone randomly torpedo your timeline later because they felt ignored. This stuff directly feeds into how you'll communicate and manage risks. Oh, and don't treat it like homework you do once - people's priorities shift, so update it as things change. It's way less painful than scrambling to fix relationships mid-project.
Honestly, most people jump straight to Gantt charts and network diagrams - CPM is the fancy term for mapping out your critical path. Microsoft Project is like the default everyone mentions, but real talk? Asana or Monday.com are way less of a headache for most projects. Excel works fine too if you're not doing anything massive. The real trick is nailing your work breakdown structure first - chunk those big deliverables into smaller pieces you can actually manage. Three-point estimation helps with timing, but mapping task dependencies is where projects usually fall apart. Whatever tool your team's already using, start there.
Honestly, don't treat risk management like some separate thing you tack on at the end. Right from the start, figure out your big risks and which stakeholders might cause drama. Planning phase is where you'll do most of the work - build that risk register and figure out your game plan. Then during execution, watch those risks constantly and jump on your responses when things start going sideways. I swear this actually saves you time even though it feels like more work upfront. Oh, and when you wrap up, write down what actually went wrong so you're smarter next time. Just add a quick 10-minute risk check to whatever reviews you're already doing.
Honestly, just jump on conflicts the second you notice them - don't let that stuff fester. Set up regular check-ins where people can actually vent, not those pointless status meetings everyone zones out in. Make sure roles are crystal clear from the start too. I swear half the drama comes from people not knowing who's supposed to do what. You'll want to watch for burnout during crunch time - people get weird when they're stressed. Oh, and celebrate the little wins! Keeps everyone focused on what you're building together instead of getting territorial about their piece of it.
So basically, you want to stack up your actual results against whatever goals you set at the beginning. Did you hit your deadline? Stay on budget? Meet quality standards and business goals? Honestly, stakeholder satisfaction surveys are pure gold - they'll tell you stuff the numbers never will. Also look at how your team performed and what risks popped up along the way. The real trick is writing down everything (even the screw-ups) so the next project team doesn't make the same mistakes you did.
Start with the basics - schedule variance, cost performance, burn rate. Those show if you're actually on track. Quality stuff matters too: defect rates, customer satisfaction scores. Honestly, I'm kinda obsessed with team velocity because it usually screams trouble before everything falls apart. Resource utilization is huge too. Oh, and don't skip stakeholder metrics - meeting attendance, how fast people respond to feedback. Sounds boring but it's not. Pick maybe 5-7 that actually match your project goals. Check them weekly. Any more than that and you'll just be drowning in spreadsheets instead of getting stuff done.
Document stuff right after each phase wraps up - not when the whole project's done and everyone's scattered to the wind. Honestly, I've watched so many teams blow this off because they're already stressed about the next deadline. Bad move. Just make a basic template: what worked, what sucked, what to do differently. Store it somewhere people can actually find later - searchable by project type or whatever makes sense. Even if you're just throwing bullet points in a Google doc for now, start the habit. Your future self (and team) will thank you when they're not reinventing the wheel every single time.
Look, communication literally makes or breaks every project phase. You need solid stakeholder buy-in right from the start, plus clear scope definition. Planning's where things get messy - your team has to actually understand their roles and deadlines. Honestly, this is where I've seen most projects either take off or completely tank. During execution, constant updates are key for catching issues early. Monitoring means being transparent about what's working and what isn't. Don't forget to document lessons learned at the end (and maybe grab drinks to celebrate). My advice? Over-communicate. People aren't mind readers.
So agile just chops up those waterfall phases and repeats them every few weeks instead. You're doing mini-cycles of planning, building, and testing in "sprints" - usually 1-4 weeks each. Way better than waiting months to find out you built the wrong thing, honestly. The phases don't disappear, they just get compressed and happen over and over. I actually prefer it now because you get constant feedback instead of that awful "hope this works" feeling at the end of traditional projects. Just map what you're already doing to sprint activities and you'll see how it translates.
Honestly, tech makes project management so much easier. Real-time dashboards show you exactly where things stand, and tools like Asana become your go-to for everything - no more digging through endless email threads (thank god). Automated task assignments keep things moving, plus the communication features actually keep your team on the same page. The AI stuff for resource planning is pretty cool too, though I'm still figuring that part out. But here's the real game-changer: the analytics help you spot what's working across projects. You'll start seeing patterns and get way better at this whole thing.
Honestly, resource stuff hits you first - people aren't available when you need them. Then stakeholders start asking for "tiny tweaks" that are actually huge changes. Communication breaks down fast too. What made sense in meetings gets confusing once work starts. Also, you're shifting from planning mode to keeping track of everything, which messes with your head a bit. Schedule your first status meetings really close together - like every few days instead of weekly. Trust me on this one. Catching problems early saves you so much pain later.
So first thing - sketch out how many people you'll need for each phase. Initiation's pretty light, execution is where you'll get slammed, then closure drops off fast. Honestly, a resource histogram is your best friend here because you can actually see where the crazy peaks are. Put your senior people on planning upfront, then move them to oversight while the junior folks do the grunt work during execution. Cross-training is clutch so you can shuffle people around as needed. Oh, and start tracking actual vs planned usage right away - I learned this the hard way but it really helps you spot trends before everything goes sideways.
Honestly, just overcommunicate from day one - way better than having confused stakeholders later. Set up weekly updates and monthly meetings, but here's the thing: actually ask for their input during planning, don't just show them finished stuff. I learned this the hard way lol. Map out who needs to be involved at what level so you're not dragging everyone into every decision. Short version? Make them feel like their time matters, not like they're stuck in another pointless meeting. Regular check-ins work if people see the value.
-
Content of slide is easy to understand and edit.
-
Easy to edit slides with easy to understand instructions.