


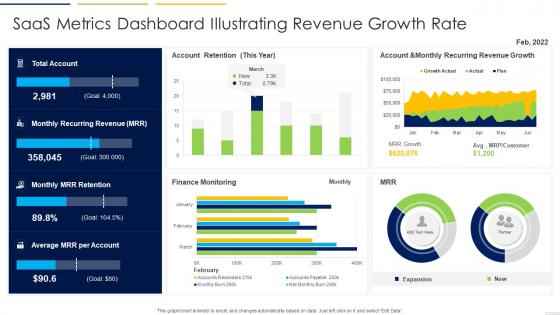
SaaS Metrics Dashboard Illustrating Revenue Growth Rate




Try Before you Buy Download Free Sample Product
 Impress Your
 Audience
 100%
100% Editable
 Save Hours
 of Time


Our SaaS Metrics Dashboard Illustrating Revenue Growth Rate are topically designed to provide an attractive backdrop to any subject. Use them to look like a presentation pro.
People who downloaded this PowerPoint presentation also viewed the following :
SaaS Metrics Dashboard Illustrating Revenue Growth Rate with all 7 slides:
Use our SaaS Metrics Dashboard Illustrating Revenue Growth Rate to effectively help you save your valuable time. They are readymade to fit into any presentation structure.





FAQs for SaaS Metrics Dashboard Illustrating
Honestly, start with the basics: MRR, churn rate, CAC, and customer lifetime value. Those four will tell you most of what you need to know. Then add CAC payback period and gross revenue retention once you get the hang of tracking regularly. Net promoter score is clutch too - I learned this the hard way but unhappy customers will tank everything else. Monthly tracking is the sweet spot, though I usually peek at MRR weekly because I'm impatient like that. Don't go crazy with advanced metrics right away. Get these nailed down first, then you can layer on the fancy stuff later.
Look, CAC hits your profits hard because you're paying upfront while revenue trickles in monthly. Say you spend $500 to get a customer who only pays $50/month - you're bleeding cash for 10 months before breaking even. That's brutal. Your LTV should be at least 3x your CAC, honestly anything less and you're probably screwing yourself. I'd check this monthly because when payback periods start stretching out, it usually means your acquisition channels are getting pricey. Time to shift your budget around and find cheaper ways to grab customers.
CLV basically shows you what each customer is actually worth over time. So if you're getting $10k lifetime value but only charging $50/month, you're definitely underpricing. Calculate it for different customer segments first - that's where you'll find the real insights. Higher CLV means you can spend more on acquiring customers and probably charge more too. I always tell people to work backwards from CLV when setting prices. Just make sure your acquisition costs stay way below that number or you'll burn through cash fast. It's honestly one of the best ways to figure out if you're leaving money on the table.
So here's what I'd do - calculate your churn by dividing lost customers by total customers each month and year. But don't just look at the overall number (trust me, it'll probably hurt at first). Break it down by customer size, where they came from, how they use your product. That's where you'll actually spot patterns. Watch for warning signs like people logging in less or suddenly flooding support with tickets. Set up some kind of health scoring system so you can reach out before they bail. Oh, and definitely do exit interviews - people will tell you exactly what went wrong if you just ask.
MRR tracks your monthly subscription income - super straightforward but honestly game-changing for planning. Take any recurring payment and convert it to monthly: $120/year becomes $10 MRR, $50 quarterly is about $16.67. The math isn't complicated. What makes it brilliant? One-time sales and seasonal weirdness don't mess with your numbers anymore. You get this clean view of predictable cash flow. I'd definitely break it down by customer type too - helps you catch patterns before they become problems. Way better than staring at lumpy revenue reports all day.
Expansion revenue is gold - it pushes your NRR over 100% and makes growth way more predictable. Contraction does the exact opposite, dragging everything down and forcing you to chase new customers just to break even. What I love about expansion is it compounds. You're growing accounts you already have instead of constantly prospecting (though yeah, you still need new logos). Contraction usually means something's broken - either product-market fit or your customer success team isn't doing their job. Track both monthly and figure out why people are contracting. Downgrading features? Cutting seats? That's where you focus.
Honestly, customer health metrics are where you'll get the real insights. NPS shows if people actually love your product enough to tell others about it. Track your daily/monthly active users too - there's a huge difference between someone paying and someone actually engaged. Support ticket volume is super telling (angry customers bail fast). I always obsess over feature adoption rates since they reveal so much about product-market fit. Time-to-value matters - how fast do new users get that "aha moment"? Onboarding completion rates are clutch too. Don't try tracking everything though. Pick 2-3 that match your biggest headaches right now.
Yeah NPS is solid for SaaS but don't make it your whole world. Quick way to see if people actually like you enough to tell their friends - and referrals are huge in this space. Problem is it won't tell you jack about *what's* broken. I've watched teams freak out over their score dropping while completely ignoring the fact that half their users never even logged in again lol. Track it quarterly for sure. Just throw in some CSAT surveys after support tickets and keep an eye on which features people actually use. Oh, and definitely reach out to anyone who gives you a bad score - that's where the real insights are.
Okay so first thing - audit where people are actually dropping off in your funnel. That's your starting point. Then kill the friction at those spots. Make signup dead simple, swap demos for free trials if you can, and honestly your onboarding should be so easy it's almost boring. Pricing pages are weirdly powerful - test the hell out of those because tiny tweaks can make a huge difference. Also segment your leads better so you're not sending the same generic stuff to everyone. Oh and definitely retarget people who almost signed up for trials but didn't. Those are low-hanging fruit you're probably leaving on the table.
So basically cohort analysis groups users who started at the same time and tracks what happens to them. Like, you can see if people who joined in January are still around by July. Way better than just looking at overall retention because you spot actual patterns. Maybe holiday signups bail faster, or that big feature update in Q3 actually worked. I honestly think it's one of those things that seems obvious once you see it, but most people just stare at aggregate numbers and wonder why their retention sucks. The real win is figuring out which groups stuck around and copying whatever made them different.
Honestly, forget basic DAU/MAU stuff - everyone obsesses over those numbers but they don't tell you much. Track time-to-value instead and how deep people actually go with your features. Cohort analysis is where it's at... are new users actually sticking or just bouncing after they sign up? Most companies I know are getting fooled by vanity metrics right now. Find those "aha moments" - specific actions that predict who'll stick around long-term. Session depth plus frequency matters too since high frequency but shallow sessions usually means people are lost. Just pick your top 3 behaviors that predict renewals and build dashboards around those.
Honestly, usage data tells you everything you need to know about your customers. People who log in regularly and actually use your core features? They're gonna stick around and love you for it. When I see someone's usage trending up over time, that's basically a green flag for renewal. But here's the thing - dropping usage is like a canary in a coal mine. You'll spot churn risk way before they actually bail. Track your daily active users, how they're adopting features, how deep their sessions go. Set up some alerts so you can jump in when things start sliding. Way easier than trying to win them back later.
Ugh, the worst trap is getting obsessed with vanity metrics - like celebrating 10k signups when only 500 people actually use your product. I've totally done the cherry-picking timeframes thing to make quarterly reports look less terrible. Also don't mix customer segments when you're calculating LTV because that'll mess everything up. Pick maybe 3-4 metrics that actually connect to each other instead of watching one number in isolation. Track trends over months, not daily - you'll drive yourself crazy otherwise. Honestly the hardest part is just being disciplined about it.
Honestly, benchmarking is a game-changer for figuring out if your metrics actually suck or not. Like, you might think your 5% churn rate is awful, but then you find out industry average is 7% - boom, you're suddenly winning! It gives you real targets instead of just shooting in the dark. Investors eat this stuff up too, which is annoying but whatever. Find benchmarks specific to your vertical and company size (super important), then check in quarterly. You'll spot problem areas fast and know exactly where to focus your energy. Way better than guessing your way through growth.
Dude, you really need to break down your metrics by customer segments. Like, a 5% churn rate sounds okay until you realize your enterprise folks are only churning at 2% but your small business customers are bailing at 15% - that's a completely different problem to solve. Each segment has totally different LTV and CAC numbers too. Blended metrics are basically useless, honestly. Pick your 2-3 most important customer types (size, industry, plan level, whatever) and track everything separately for each group. It'll change how you think about your whole strategy.
-
Well-designed and informative templates. Absolutely brilliant!
-
The templates are the best in class. Very clear and innovative graphics! I am excited to explore and download more presentations.