


Business Analytics For Decision Making Powerpoint Ppt Template Bundles




Try Before you Buy Download Free Sample Product
 Impress Your
 Audience
 100%
100% Editable
 Save Hours
 of Time


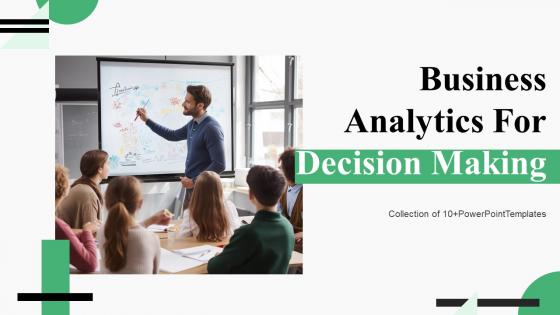
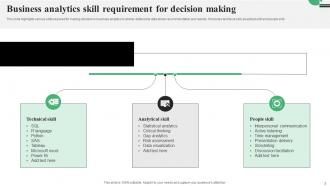
Unlock the power of data with our comprehensive PPT presentation on Business Analytics for decision Making. In todays competitive landscape, data analytics is the cornerstone of informed decision making. This professionally crafted presentation will equip you with the knowledge and tools to harness the potential of data driven insights. Explore the intricacies of data analytics, understanding its role in shaping decisions. Dive into data visualization techniques, transforming complex data into actionable insights. Learn how market research can guide strategic choices and enhance your competitive advantage. Discover the significance of Business Decision Support Systems DSS in streamlining operations and optimizing outcomes. With this PPT, you well gain a holistic understanding of data analytics, empowering your organization to make well informed, data driven decisions that drive success. Stay ahead of the curve and elevate your decision making prowess with our insightful presentation.
People who downloaded this PowerPoint presentation also viewed the following :
Business Analytics For Decision Making Powerpoint Ppt Template Bundles with all 23 slides:
Use our Business Analytics For Decision Making Powerpoint Ppt Template Bundles to effectively help you save your valuable time. They are readymade to fit into any presentation structure.










FAQs for Business Analytics For Decision Making Powerpoint
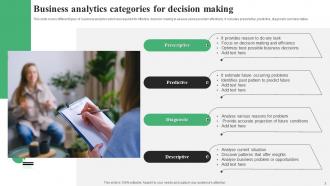
Hey! So there's three main types. Descriptive just shows what already happened - like your sales numbers or how many people visited your site. Pretty straightforward stuff. Predictive tries to guess what's coming next by looking at patterns. Then prescriptive goes a step further and tells you what you should actually do about it. Honestly, I think of it as past, future, and action plan. Most companies I know start with descriptive since it's way easier, then work up to the fancier predictive stuff once they've got their data game figured out. Makes sense to crawl before you run, you know?
Look, you probably already have tons of useful data just sitting there - sales records, website visits, customer info. Most people don't realize how much they can learn from stuff they're already tracking. Google Analytics is free for web data, or honestly even Excel works great for spotting sales patterns. Here's the thing though: don't go crazy trying to analyze everything at once. Pick one question that actually matters to your bottom line. Like, when do people buy most? What products tank? Start there and you'll avoid that overwhelming feeling that makes most people quit before they even begin.
Think of data viz as translating boring spreadsheet numbers into something your brain can actually process quickly. Charts and graphs help you catch trends and weird outliers right away - way better than scrolling through endless rows of data. It's kinda like the difference between reading sheet music vs hearing the actual song, if that makes sense. Your visual processing is just faster than trying to make sense of tables. One thing though - please don't just throw everything into pie charts. Pick whatever chart type actually tells your story best.
Build quality checks right into your data pipeline from the start - don't wait until the end. Set up automated validation rules because honestly, manual checking is a nightmare and you'll miss stuff. Document where your data comes from and how it gets transformed so you can actually track down issues when they pop up. Daily dashboards for monitoring data health are a lifesaver. Create clear governance policies too (accuracy, completeness, the usual suspects). Oh, and treat this as ongoing maintenance, not some one-and-done project. Trust me, catching problems early beats scrambling to fix bad insights later.
Get Tableau or Power BI first - seriously, they'll blow your mind for visualizing data. Excel still works great for quick stuff, just gets messy with huge datasets. SQL is a must for pulling from databases, and you'll want Python or R for the statistical heavy lifting. Oh, and Google Analytics if you're doing anything web-related. Honestly though? Figure out what questions you're actually trying to answer before you go tool-crazy. I'd start with just one visualization platform and one query language. You can always add more tools later when you know what you actually need.
Dude, ML is totally changing how businesses look at their data. You don't have to sit there manually combing through Excel anymore - the algorithms just churn through huge datasets and find patterns you'd miss. What's cool is they keep learning, so your predictions actually get better over time. Customer segmentation, forecasting, all that stuff becomes way more accurate. Honestly feels like we're living in the future sometimes. But here's the thing - don't go crazy trying to automate everything right away. Start with something simple like predicting which customers might leave, then expand from there. Way less overwhelming that way.
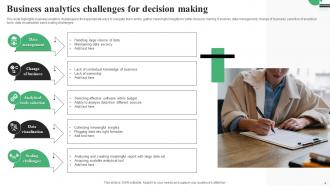
Honestly, the biggest pain points are usually messy data and getting leadership to actually care. Your data's probably way messier than you think - different formats everywhere, missing stuff, systems that can't talk to each other. It's frustrating. Getting people to trust your insights and act on them? Good luck with that one. You'll need team members who can translate between tech and business speak too. Start with something small that shows results fast, then ride that wave to tackle the bigger organizational mess. Trust me on this approach.
So you want to really get your customers? Track everything - how they browse, what pisses them off, where they bail on purchases. Most companies are shocked when they see which features people actually ignore (usually the "revolutionary" ones lol). Connect your website data with support tickets, social stuff, all of it. That's when you start seeing the real patterns. You'll predict what they need before they even know it. Pick one customer journey first though - don't try to fix everything at once or you'll go crazy.
Honestly, start with a quick audit of what you're doing now - that'll show you the biggest problems. Data privacy is huge - get real consent before grabbing personal info and anonymize whatever you can. Your models can be super biased if your training data sucks, which I've watched totally backfire on companies. Transparency matters too, especially with customers. Nobody wants creepy personalization that feels invasive. Oh, and don't make decisions that seem sketchy or discriminatory. Those three areas will cover most of your bases.
So you know how you usually find out about problems way too late? Real-time analytics flips that - you catch stuff as it's actually happening. Like if your supply chain hits a snag, you'll know immediately instead of discovering it in some weekly report when it's already a mess. Honestly, it's a game changer for making quick decisions and fixing issues before they spiral. I'd start small though - pick one area where being slow to react really costs you, then build from there once you see how much easier it makes everything.
Honestly, stick to the stuff that actually moves the needle - revenue growth, customer acquisition cost, lifetime value, conversion rates. Those vanity metrics like social media likes? Total waste of time (trust me on this one). Cash flow, inventory turnover, employee productivity - that operational stuff matters way more than people think. Pick maybe 5-7 metrics max that your team can do something about. Otherwise you'll drown in data. Set up automatic dashboards so you're not pulling reports all day. Start with what hits your bottom line directly, then add more later.
Honestly, analytics is a game-changer because you'll spot stuff your competitors totally miss. It helps predict what customers want before they even realize it - which sounds crazy but actually works. You can find new opportunities, tweak pricing on the fly, and personalize things without doing it manually for each person. The best part? No more waiting around for outdated reports or making decisions based on hunches. I'd say start with one specific problem you're stuck on, then figure out what data might solve it. Predictive stuff is where it gets really interesting - you can see market shifts coming.
Use your actual company data for training - people connect way better with problems they already know. Set up small groups so they're not drowning alone in Excel hell (because honestly, pivot tables are the worst when you're flying solo). Lunch-and-learns work great for sharing what actually worked and what totally bombed. Pair newbies with someone who knows their stuff for ongoing help. The trick is making it feel like they're gaining superpowers instead of just more work dumped on them. Give them practice time and celebrate the small wins early.
Honestly, healthcare's where I'd look first - they're throwing money at analytics for patient outcomes and cutting costs. Retail's huge too with all the personalization stuff and figuring out inventory. Finance is obviously doing fraud detection and risk management, but that space feels more competitive to me? Tech companies are killing it but like, duh. What these all have in common is massive amounts of data and they can actually see ROI immediately. If you're thinking about making the switch, pick one of these sectors. They're hiring like crazy and you'll actually learn from teams that know what they're doing instead of being the first analytics hire somewhere.
Honestly, most companies mess this up pretty bad. You gotta track your baseline metrics first, then see what changes after you roll out analytics stuff. Compare what you're spending against actual gains - like more revenue from better targeting or saving money on operations. The hard part? Figuring out what improvements actually came from your analytics vs everything else going on. I'd document specific use cases and tie them directly to results. Maybe do quarterly check-ins so you can pivot if something's not working. Oh and predictive models for reducing churn are usually a solid win if you're wondering where to start.
-
SlideTeam provides PPTs on every single topic. Their templates suit my job very well. I am very grateful!
-
“There is so much choice. At first, it seems like there isn't but you have to just keep looking, there are endless amounts to explore.”