


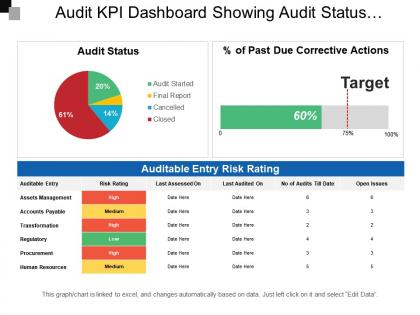
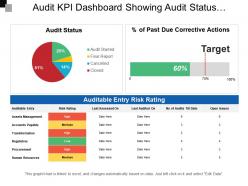
Audit kpi dashboard showing audit status auditable entry risk rating





Try Before you Buy Download Free Sample Product
 Impress Your
 Audience
 100%
100% Editable
 Save Hours
 of Time


Get that heavenly feeling with our Audit Kpi Dashboard Showing Audit Status Auditable Entry Risk Rating. Their brilliance gives great delight.
People who downloaded this PowerPoint presentation also viewed the following :
Audit kpi dashboard showing audit status auditable entry risk rating with all 6 slides:
Get creative with our Audit Kpi Dashboard Showing Audit Status Auditable Entry Risk Rating. Prove that you think out of the box.
FAQs for Audit kpi dashboard showing audit status auditable
Focus on the metrics that actually matter - audit completion rates, how long it takes from planning to final report, and whether people are fixing the issues you find. Management response times are critical because nobody wants findings just sitting there forever. Stakeholder satisfaction scores tell you if you're annoying people or adding value (honestly, both happen). Coverage metrics show you're hitting the right risk areas, and budget variance helps with future planning. Oh, and resource utilization too. Start with maybe 5-7 core ones instead of drowning everyone in data they'll ignore anyway.
Honestly, audit KPI dashboards are game-changers because you can actually see what's happening in real-time instead of guessing. You'll catch patterns way earlier - like certain areas always having issues or your team getting swamped. Makes those exec meetings so much smoother when you've got actual visuals instead of rambling through Excel sheets (been there, not fun). Focus on the metrics leadership actually cares about - completion rates, how serious findings are, remediation timelines. I'd start with maybe 3-5 KPIs max. Don't overcomplicate it at first.
Honestly, dashboards are a game changer for audit stuff. Way better than drowning in Excel hell all day. You'll spot trends super fast and see bottlenecks right away. When you're presenting to higher-ups, visuals beat endless rows of data every single time - learned that the hard way. Real-time updates mean you can actually get ahead of problems instead of scrambling after. Oh, and don't try to track everything at once. Pick your top 3-5 metrics that actually matter to your team first, then build from there.
Monthly updates work fine for most audit KPIs, but weekly is honestly better if you can manage it. Daily feels like way too much unless there's some regulatory fire you're putting out. The thing is, you need to be consistent - I've seen teams do random updates and it's pretty useless. Weekly helps you catch stuff before it blows up, while monthly still gives you decent trend data without drowning in details. Oh, and definitely set up automated pulls if possible. Nobody wants to mess with spreadsheets every week.
Honestly, Power BI or Tableau are your best bets for audit dashboards - they handle that kind of data really well. Excel works if money's tight, but trust me, it gets messy quick with big datasets. I've watched too many people try cramming everything into spreadsheets and it's just... why do that to yourself? Check if you're already using ACL or IDEA first though. They might have dashboard stuff built in. My advice? Start with whatever your team actually knows how to use. Getting everyone on board is usually harder than the tech part anyway.
Honestly, start with solid data governance or you'll hate yourself later. Set up automated validation rules and pick one source of truth for each data point - don't let people pull from random spreadsheets. Regular reconciliation is huge too. Train your team on consistent entry standards (this part's boring but necessary). Version control any manual stuff and schedule audits of the actual dashboard data. Oh, and create approval workflows for changes - otherwise Bob from accounting will "fix" things at 2am and break everything. Trust me, fixing bad data later is way more painful than doing it right upfront.
Honestly, start with audit cycle time - that's what your boss will ask about first anyway. Track how long each audit takes from kickoff to wrap-up. You'll also want to watch hours per audit and how long it takes to actually resolve findings. Rework rates are huge too because redoing work is just painful for everyone involved. Cost per audit matters if you're trying to justify headcount or budget stuff. Oh, and auditor utilization - basically making sure people aren't sitting around waiting for work or drowning in too much of it. Cycle time's your best starting point though. Shows you exactly where things get stuck.
Honestly, real-time data is a game changer for audit dashboards. You'll spot problems as they happen instead of discovering them weeks later when you can't do much about it. Fresh data means stakeholders actually trust what they're seeing - nobody wants to make decisions off old information from last month. The trick is automating your data feeds so everything updates without you having to manually refresh it constantly (which is a pain anyway). Immediate visibility into compliance gaps and performance trends? That's where you start catching things before they become real headaches.
Look, good UI can totally make or break your audit dashboard. People won't use it if they can't figure out where anything is - I've watched perfectly good dashboards collect digital dust because the interface was garbage. You want clear visual hierarchy and logical grouping so auditors aren't hunting around for basic metrics. Consistent colors and readable fonts matter more than you'd think. Smart filtering helps too. The whole point falls apart if users get frustrated and give up. Clean layouts are your friend here, and definitely test it with real people first. Nothing worse than launching something nobody actually wants to use.
Start by figuring out what your industry actually needs to track. Healthcare? You're looking at HIPAA breaches and patient access logs. Finance people need SOX controls and capital ratios. Manufacturing focuses on ISO standards and safety incidents - totally different beast. Here's what worked for me: build custom widgets that match what regulators actually look for, not just generic audit checkboxes. Most tools make this pretty straightforward. Create templates you can reuse, then just plug in different data sources when audit season rolls around. Way easier than starting from scratch every time.
Here's what's worked for me - map your audit KPIs straight to whatever your company's actually trying to accomplish. Revenue growth the big thing? Focus on metrics around process efficiency and risk stuff that hits the bottom line. Honestly, I've watched so many audit teams waste time tracking things leadership couldn't care less about. Talk to the business folks first - figure out what's stressing them out, then build KPIs showing how your work tackles those exact problems. Your dashboard needs to tell their story, not just yours. Oh, and set up quarterly check-ins since priorities always shift around here.
Honestly, KPI dashboards are like having a time machine for your audit data. You can spot trends super easily - like which departments keep screwing up the same stuff or if compliance scores tank during certain seasons. Way better than drowning in Excel sheets, trust me. The visual charts help you catch things like audit areas that always run over time or teams that clearly need more training. Plus you can set up automated reports so you're not constantly pulling data manually - because who has time for that? Really saves you from missing patterns that only show up over months.
Ugh, data quality is going to be your biggest headache - trust me on this one. Getting clean info from different systems? Total mess. Plus everyone's gonna fight over which metrics actually matter since they all have their pet priorities. The tech integration part gets ugly too, especially when you're trying to connect random audit tools that don't want to play nice together. Oh and here's the thing nobody talks about - if your dashboard sucks to use, people will just ignore it completely. Honestly? Start with maybe 3-5 metrics that don't make anyone mad, then build from there once you've got some wins under your belt.
Honestly, just watch if people actually use the thing. Track which reports get clicked on most and if decisions are happening faster. The real win is catching problems before they blow up into audit findings - that's what matters most. Set some baseline numbers before you launch it, then check quarterly. Are users giving good feedback? How long does it take them to find what they need? I'd also look at whether your team is spotting issues earlier than before. That's probably the best indicator of whether it's worth the effort. Oh, and don't overthink it - if nobody's logging in regularly, that tells you everything you need to know.
Talk to your stakeholders early - like during design, not after you've built the whole thing. Ask what metrics they actually care about, because I guarantee it's different than what you think. Survey the audit team, management, board members about what sucks with their current reports. Honestly, I've watched so many dashboards get built in a bubble that end up gathering dust. Once it's live, do monthly check-ins to see what's working and what isn't. Throw a simple feedback form right in the dashboard too - people will tell you what's broken while they're actually using it, which is way more helpful than asking them to remember later.
-
Good research work and creative work done on every template.
-
Great experience, I would definitely use your services further.