


Power of the quarterly business review powerpoint presentation with slides


Try Before you Buy Download Free Sample Product
 Impress Your
 Audience
Editable
of Time


Building a good PPT example of quarterly business review PowerPoint presentation in many ways is a tedious and time killing exercise. To help you out here we are showcasing a pre built PPT example for delivering a stunning business review ppt. You can use our presentation deck to illustrate your quarterly performance review report about company’s activities in preceding year. Going further, with our PPT sample file it is pretty simple to put emphasis on future planning or forecasting about business goals to keep the company on right path. But that’s not all; using our PPT slide show you can make a visual communication analyzing what went wrong and what worked well in last quarter thereby motivating employees to accomplish targets in next quarter. Good news is that exclusive qbr templates like return on investment analysis, value proposition scorecard, customer use cases, phases of implementation, customer service benchmarking all are available in one place. All in all, become star presenter of your company by delivering a stunning executive review PowerPoint showNever feel hamstrung with our Power Of The Quarterly Business Review Complete Powerpoint Deck With Slides. They give you an array of efficient choices.
People who downloaded this PowerPoint presentation also viewed the following :
Content of this Powerpoint Presentation
Slide 1: This slide introduces POWER OF THE QUARTERLY BUSINESS REVIEW. State your company name here.
Slide 2: This is an Agenda slide. Add your agenda in these boxes.
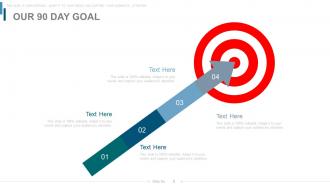
Slide 3: This slide states Our 90 Day Goal with arrow and target imagery.
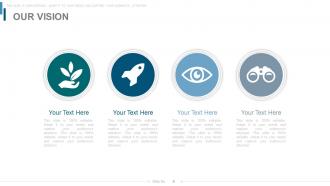
Slide 4: This is Our Vision slide. State vision, mission etc. here.
Slide 5: This is The Core Team slide. Present team specifications, information etc. here.
Slide 6: This slide displays ORGANIZATION PROFILE – AREA OF FOCUS in a radar chart/ graph form.
Slide 7: This is Completed, Outstanding And New Items slide with text boxes.
Slide 8: This is Return On Investment slide depicting- Success, Sales, Capital, Investment, Return.
Slide 9: This slide presents Return On Investment Analysis with respect to- COST, ROI, TIME.
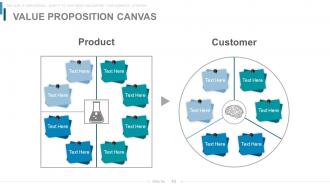
Slide 10: This slide presents Value Proposition Canvas of Customer and Product in a creative form.
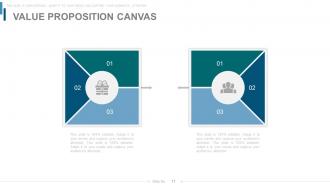
Slide 11: This slide also showcases Value Proposition Canvas.
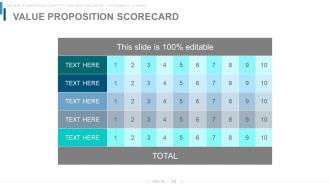
Slide 12: This slide displays Value Proposition Scorecard.
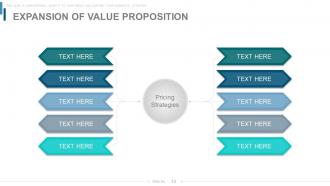
Slide 13: This slide depicts Expansion Of Value Proposition with Pricing Strategies.
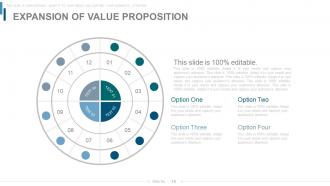
Slide 14: This is another slide showcasing Expansion Of Value Proposition in a circular form.
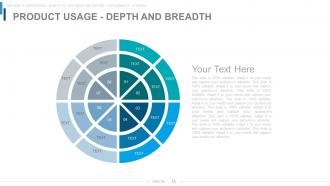
Slide 15: This slide displays Product Usage- Depth and Breadth in a circular form.
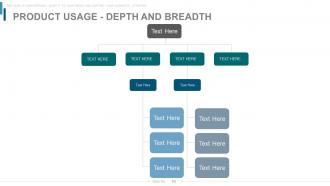
Slide 16: This is another slide displaying Product Usage in a flow chart.
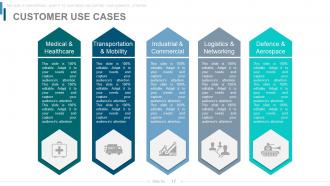
Slide 17: This slide showcases Customer Use Cases with the following- Medical & Healthcare, Transportation & Mobility, Industrial & Commercial, Logistics & Networking, Defence & Aerospace.
Slide 18: This slide states Phases Of Implementation with text boxes.
Slide 19: This slide also states Phases Of Implementation with arrow imagery.
Slide 20: This slide depicts Last 90 Days Results with boxes and icons.
Slide 21: This is another slide depicting Last 90 Days Results.
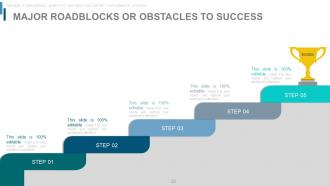
Slide 22: This slide displays Major Roadblocks Or Obstacles To Success with creative imagery.
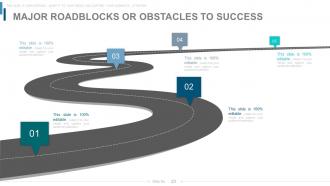
Slide 23: This is another slide showing Major Roadblocks Or Obstacles To Success in a roadmap image form.
Slide 24: This is Benchmarking Competitive Intelligence slide in a matrix form.
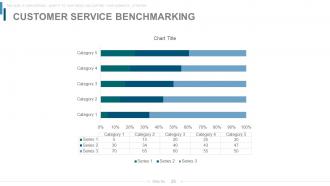
Slide 25: This slide presents Customer Service Benchmarking in a bar graph/ chart form.
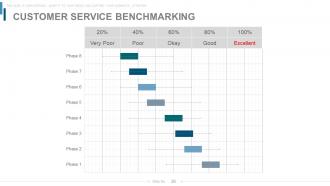
Slide 26: This is another slide presenting Customer Service Benchmarking with Very Poor, Poor, Okay, Good and Excellent parameters.
Slide 27: This slide also showcases Customer Service Benchmarking in Percentage.
Slide 28: This is Goals And Success Metrics slide.
Slide 29: This slide displays HEALTH SCORECARD.
Slide 30: This is a 90 Day Plan slide to state your plans etc.
Slide 31: This slide also showcases 90 DAY PLAN.
Slide 32: This slide displays a PRODUCT ROADMAP to present product goals, milestones etc.
Slide 33: This is another slide showcasing Product Roadmap.
Slide 34: This is titled Additional Slides to proceed forward. Change/ alter content as per need.
Slide 35: This is an About Us slide. State company or team specifications here.
Slide 36: This slide shows Comparison of two entities in butterfly chart form.
Slide 37: This slide presents Financial scores in a venn diagram form.
Slide 38: This is a Business Quotes slide to quote something you believe in.
Slide 39: This is a SEGEMENTATION slide with High, Medium and Low parameters.
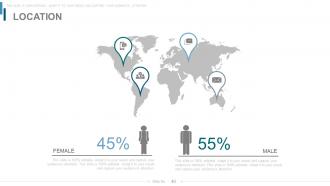
Slide 40: This is a Location slide to present global growth, presence etc. on a world map image.
Slide 41: This is a Timeline slide to show evolution, growth, milestones etc.
Slide 42: This is a Post It slide to mark events, important information etc.
Slide 43: This is a Newspaper slide to show news, events etc. You can change the slide contents as per need.
Slide 44: This is a craetive Puzzle slide to show information, specifications etc.
Slide 45: This slide shows Target imagery with text boxes. State targets, goals etc. here.
Slide 46: This is a Venn diagram image slide to show information, specifications etc.
Slide 47: This slide presents the SWOT Analysis in a circular image form comprising of- Threats, Strengths, Weaknesses, Opportunities
Slide 48: This is a Mind Map image slide to present information, specifications etc.
Slide 49: This slide displays ANSOFF PRODUCT MATRIX in terms of Risk and Rewards.
Slide 50: This is a Lego blocks creative slide to present information, specifications etc.
Slide 51: This is Circular Chart Financial Analysis Team Management slide in people silhouttes and puzzle imagery form.
Slide 52: This slide showcases Organization Chart in a hierarchy form with text boxes.
Slide 53: This is a Bulb or Idea slide to state a new idea or highlight specifications/information etc.
Slide 54: This is a Magnifying glass image slide to show information, scoping aspects etc.
Slide 55: This is a Bar Graph image slide to show product comparison, growth etc.
Slide 56: This is a Funnel diagram slide. Put information in funnel form here.
Slide 57: This slide displays Thank You slide with address, contact numbers and email address.
Power of the quarterly business review powerpoint presentation with slides with all 57 slides:
Enable folks to deal with complications that arise with our Power Of The Quarterly Business Review Complete Powerpoint Deck With Slides. Get them aware of the intricacies.
-
Power of the Quarterly Business Review
-

Agenda
-
Our 90 Day Goal
-
Our Vision
-

The Core Team
-
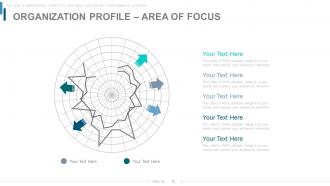
Organization Profile Area of Focus
-
Completed Outstanding and New Items
-
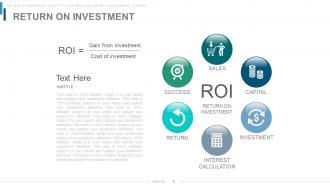
Return on Investment
-
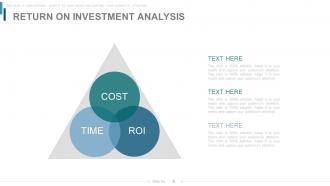
Return on Investment Analysis
-
Value Proposition Canvas
-
Value Proposition Canvas
-
Value Proposition Scorecard
-
Expansion of Value Proposition
-
Expansion of Value Proposition
-
PRODUCT USAGE DEPTH AND BREADTH
-
PRODUCT USAGE DEPTH AND BREADTH
-
Customer Use Cases
-
Phases of Implementation
-
Phases of Implementation
-
Last 90 Days Results
-
Last 90 Days Results
-
Major Roadblocks or Obstacles to Success
-
Major Roadblocks or Obstacles to Success
-

Benchmarking Competitive Intelligence
-
Customer Service Benchmarking
-
Customer Service Benchmarking
-
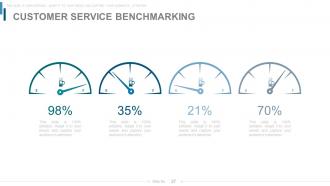
Customer Service Benchmarking
-
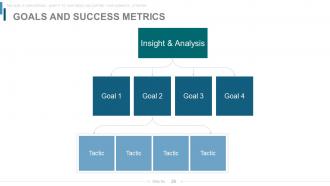
Goals and Success Metrics
-
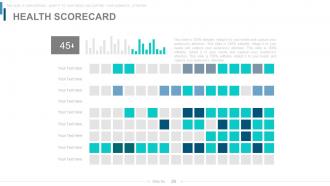
Health Scorecard
-
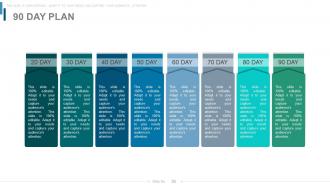
90 Day Plan
-

90 Day Plan
-
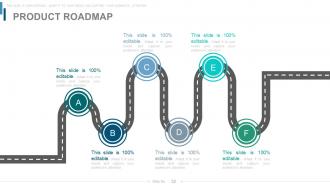
PRODUCT ROADMAP
-
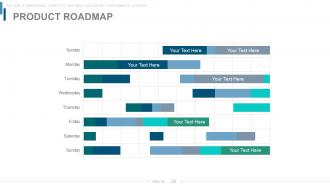
PRODUCT ROADMAP
-

Additional Slides
-

About Us
-
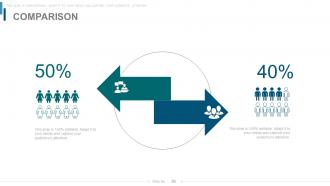
Comparison
-
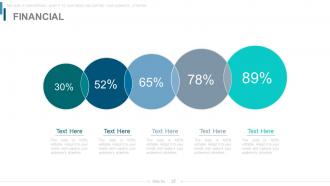
Financial
-

Quotes
-
Segmentation
-
Location
-
Timeline
-
Post It
-

Newspaper
-
Puzzle
-

Target
-
Venn Diagram
-
SWOT Analysis
-

Mind Map
-
Ansoff Product Matrix
-
LEGO
-

Circular Chart Financial Analysis Team Management
-
Organization Chart
-
BULB OR IDEA
-
Magnifying Glass
-
Bar Graph
-
Funnel
-

Thank You Slide
FAQs for Power of the quarterly business review powerpoint
So QBRs should hit four things: how you did against goals, wins/challenges, financials, and what's next strategically. Here's the thing - people always rush through the "why" behind results, but that's honestly where the gold is. Don't just dump numbers on everyone. Look at trends and what they actually mean for your business. Mix hard data with what your team's seeing on the ground. I always think the best QBRs feel less like reporting and more like real problem-solving. End with concrete action items and reprioritized stuff for next quarter, otherwise it's just a fancy show-and-tell.
Dude, visuals totally transform QBRs. Instead of everyone glazing over during spreadsheet hell, they actually follow your story. Line charts show trends instantly. Bar graphs let you compare team performance. When someone inevitably asks "but what about X?" you've got dashboards to dig deeper. I've literally watched boring QBRs turn into real strategy sessions just by ditching tables for charts. Though honestly? Less is more here. Pick maybe 3-4 charts that back up your main points. Don't dump every metric you've got - that's how you lose people again.
Honestly, less is more here - stick to maybe 5-7 metrics that actually matter for where you're headed. Revenue growth and customer stuff (acquisition, retention) are obvious picks. But here's the thing: mix in some forward-looking metrics too, like pipeline health or satisfaction scores. Those help you catch problems before they tank your numbers. Don't just throw random data at people. Pick metrics that connect to each other and tell a coherent story about your business. If you can show why metric A affects metric B, you'll actually keep people engaged instead of watching them zone out during your presentation.
Honestly, it's all about reading the room and tailoring your approach. Execs want the big picture stuff - strategic wins, key metrics, how you're driving business results. Don't bog them down with operational details. Department heads? They'll want more tactical info about team performance and how things affect other departments. Finance will always nitpick your budget numbers no matter what (learned that the hard way). For frontline managers, highlight team successes and where they need backup. I usually prep different talking points for each group, sometimes even separate decks. Start with whatever matters most to that specific audience - saves everyone time.
Dude, you HAVE to tell a story with your QBR or everyone will zone out. Numbers alone are boring as hell. Connect your wins and challenges into an actual narrative - like you're explaining your quarter to someone who actually gives a shit about the outcome. Start with where you were, walk through what went down (good and bad), then paint the picture of what's next. I always write my story first, then worry about the slides later. Way easier that way. Your stakeholders need to feel like they're part of the journey, not sitting through some data dump presentation.
Honestly, stick to every three months - there's a reason they call them quarterly reviews! You need that time gap to actually see meaningful trends and gather real data. Monthly ones just burn everyone out without adding much value (learned that the hard way at my last job). The trick is being consistent about it. Pick whether you're doing calendar or fiscal quarters and block those dates way ahead of time. Don't let them slip either - once you start pushing meetings back, you lose that strategic rhythm completely. Your team needs to know when they're coming.
Oh man, don't just throw a bunch of data at them without any storyline - they'll check out immediately. Connect the dots between what happened and what it actually means for the business. And honestly? Don't make it all sunshine and rainbows. We've all had rough quarters, so be real about challenges but come with solutions ready. Skip the microscopic fonts and messy charts too (seriously, nobody wants to squint). Practice beforehand and prep for the hard questions. Oh, and have backup slides ready in case they want to dig deeper into something specific.
Dude, QBR prep used to kill me until I figured this out. Dashboard tools like Tableau or Power BI will pull your metrics automatically - no more copy/pasting numbers like a robot. Set up templates that connect directly to your CRM so slides populate themselves. Game changer, honestly. Monday or Asana work great for tracking those action items from last quarter (you know, the ones everyone conveniently forgets about). My approach: list out what data you show every single QBR, then figure out which pieces you can automate or at least template. Saves hours.
Honestly, the secret is getting people involved from minute one. Open with something they actually care about - a big win, or that challenge everyone's been dealing with. Throw in polls or just ask "who's seen this before?" to get hands up. Customer stories work way better than boring slides, trust me. When you ask questions, actually wait for answers (awkward silence and all). Oh and don't skimp on Q&A time - that's usually when the good stuff comes out. Breakout discussions help too if you've got time.
Start a feedback log after each QBR - just jot down what worked and what bombed. I totally screwed up once because I kept cramming text on slides after getting told not to lol. Write down stuff like how the flow felt, which data clicked, what got people talking. When prepping your next one, actually use those notes. If they wanted more visuals last time, open with charts this round. Oh and grab someone who was there before to peek at your draft - they'll catch things you miss. Honestly, treating feedback like a GPS instead of suggestions you can ignore makes such a difference.
90 minutes to 2 hours tops - seriously, anything longer and people start checking their phones. Break it down roughly 30% reviewing last quarter's numbers, 40% on strategic stuff for next quarter, then wrap with action items. The 3+ hour QBRs with no agenda? Total nightmare. Actually have conversations instead of just death by PowerPoint. Oh and this might be obvious but always end with who's doing what by when - otherwise nothing actually happens after you leave the room.
Dude, you're missing SO much when teams don't talk before QBRs. Sales has the real customer feedback. Marketing knows which leads are actually converting (or totally bombing). Product teams can explain why certain features got delayed again. Finance brings the numbers that make everything click. Honestly, I used to skip the pre-alignment meetings because they felt like extra work, but those cross-team conversations reveal patterns you'd never catch otherwise. Set up quick sync sessions beforehand - you'll actually get excited about presenting instead of dreading it.
Honestly, nail down your outcomes before anyone even walks in the room. Each agenda item needs clear, measurable goals - otherwise you'll just end up in another status update snoozefest (been there way too many times). Focus on actual decisions, not progress reports. Someone owns every action item that comes up, no exceptions. Oh and here's the thing - schedule follow-ups 2-3 weeks out or people will conveniently "forget" their commitments. Keep a parking lot doc for random stuff that pops up so you don't get derailed. Trust me on this one.
So for your QBR, try adding a "values spotlight" section where you call out team members who really lived your company values this quarter. Share the specific stories - like how someone's decision actually moved the needle on results. Case studies work great too. I always get excited when people finally see how values connect to real outcomes (those lightbulb moments are the best!). Don't just talk about values abstractly - show concrete examples of teams making choices that aligned with your principles. Celebrate the wins that happened because people actually walked the walk.
Dude, so many options for making QBRs not suck. Tableau and Looker are solid for charts that actually look good. Canva works too if you want cleaner slides without much effort. Your CRM probably has decent reporting already - Salesforce dashboards aren't terrible for this stuff. Here's the thing though: organize your data first or you'll be scrambling like an idiot at the last second (been there). Sales ops usually has templates, or just grab a QBR framework online. Find one template you like and tweak it for your metrics. Way easier than starting from scratch every quarter.
-
It saves your time and decrease your efforts in half.
-
Best way of representation of the topic.