


Survey dashboard on basis of gender and demographic powerpoint template


Try Before you Buy Download Free Sample Product
 Impress Your
 Audience
Editable
of Time


Our Survey Dashboard On Basis Of Gender And Demographic Powerpoint Template are topically designed to provide an attractive backdrop to any subject. Use them to look like a presentation pro.
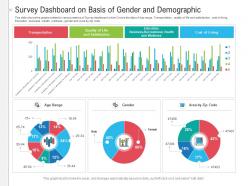
This slide shows the graphs related to various metrics of Survey dashboard which Covers the data of Age range, Transportation, quality of life and satisfaction, cost of living, Education business, health, wellness, gender and Area by zip code. This is a Survey Dashboard On Basis Of Gender And Demographic Powerpoint Template drafted with a diverse set of graphics, that can be reformulated and edited as per your needs and requirements. Just download it in your system and make use of it in PowerPoint or Google Slides, depending upon your presentation preferences.
People who downloaded this PowerPoint presentation also viewed the following :
Survey dashboard on basis of gender and demographic powerpoint template with all 2 slides:
Use our Survey Dashboard On Basis Of Gender And Demographic Powerpoint Template to effectively help you save your valuable time. They are readymade to fit into any presentation structure.
Most Relevant Reviews
-
Content of slide is easy to understand and edit.
-
Very well designed and informative templates.
-
Commendable slides with attractive designs. Extremely pleased with the fact that they are easy to modify. Great work!