


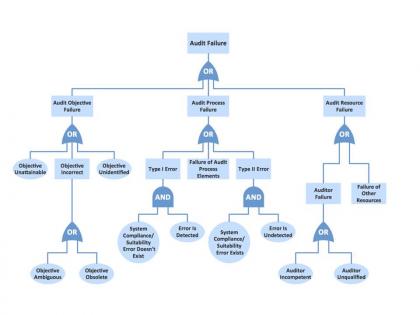
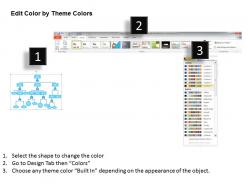
0514 fault tree analysis with symbols combine both into 1 slide powerpoint presentation




Try Before you Buy Download Free Sample Product
 Impress Your
 Audience
 100%
100% Editable
 Save Hours
 of Time


Our 0514 Fault Tree Analysis With Symbols Combine Both Into 1 Slide Powerpoint Presentation come in a fantastic array. They offer a broad canvas of exclusive craftsmanship.
People who downloaded this PowerPoint presentation also viewed the following :
0514 fault tree analysis with symbols combine both into 1 slide powerpoint presentation with all 8 slides:
Our 0514 Fault Tree Analysis With Symbols Combine Both Into 1 Slide Powerpoint Presentation contain all the essentials. Every critical aspect is catered for.
FAQs for 0514 fault tree analysis with symbols combine both into 1
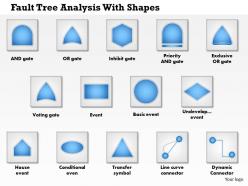
So for FTA you've got three main pieces - the top event (whatever bad thing you're trying to prevent), logic gates, and basic events at the bottom. Logic gates are honestly the trickiest part but they're super useful. AND gates mean multiple failures have to happen together, OR gates mean just one thing going wrong can screw everything up. I'd start with nailing down your top event first since that drives everything else. Then just work backwards step by step. It's like reverse engineering a disaster, which sounds way more dramatic than it actually is.
So FTA starts with the bad thing that already happened and works backwards to find all the causes - like being a detective. FMEA does the opposite - you go through every single component and ask "what could go wrong here?" It's honestly pretty tedious but thorough. If you've got one specific nightmare scenario you're worried about, go with FTA. Need to check everything systematically? That's FMEA territory. I usually lean toward FMEA for new designs since you catch weird failure modes you wouldn't think of otherwise.
Hey! So here's the thing about fault trees - timing doesn't matter at all. You're working backwards from what went wrong, just mapping out the logical connections between different failures. Honestly took me forever to wrap my head around that when I first learned it. Focus on the "what" and "how" instead of "when" stuff happened. Short answer: you're looking for every possible combo of basic events that could cause your main problem. That's what makes fault trees so useful compared to other methods - you get this complete picture of failure scenarios without getting bogged down in sequence. Pretty cool once you get it.
So basically you take the worst possible outcome - like a plane crash or someone dying - and trace backwards to find every single thing that could cause it. Start at the top with your nightmare scenario, then map out all the ways it could happen. Honestly gets pretty dark when you see how much can go sideways. But FTA's super useful for catching those "oh shit" moments before they're actual disasters. You'll spot weak points in your design and places where you need backup systems. Pro tip though - get your whole team in on this, because you WILL miss stuff if you're doing it solo.
So for fault tree software, I'd probably go with **Isograph FaultTree+** or **PTC Windchill FTA** if you've got the budget - they're expensive but really solid for complex stuff. **ITEM ToolKit** is decent too. **OpenFTA** is free and actually works pretty well, though the interface looks like it's from 2005 or something. For simple trees, you could honestly just use **Visio** or **Lucidchart**. I'd try FaultTree+ first if you're doing serious reliability analysis, but maybe mess around with OpenFTA to learn the basics since it won't cost you anything.
So basically, AND gates are your friends - everything has to fail for the system to go down, which keeps your failure probability low. OR gates though? Total pain. Just one input failing and boom, you're screwed. I usually start by mapping out where the OR gates sit in the tree first. Higher up they are, the more failure paths you've got cascading through your system. AND gates kind of act like buffers. Here's the thing - don't waste time trying to fix everything. Focus your effort on whatever feeds into those OR gates. That's where you'll actually make a difference in your overall reliability.
So cut sets are basically the combos of failures that'll kill your whole system - like the weakest links you gotta watch out for. If everything in a cut set breaks at once, you're screwed. The smaller ones are scarier since fewer things need to go wrong. Single-point failures? Yeah, those are the absolute worst. You want to find your minimal cut sets first - they show you exactly which parts are most critical. That's where you'd add backup systems or beef up reliability. Honestly it's kind of like knowing which dominoes will definitely topple the rest.
Get a few people to review it first - you miss obvious stuff when you've stared at something too long. Check each gate systematically and make sure the AND/OR logic actually works (seriously, half the trees I see have this backwards). Test it against real failures if you can dig up the data. Your operators and maintenance crew are gold mines here - they've seen how stuff breaks in ways you'd never think of. Run some sensitivity analysis to figure out what's actually driving your risk numbers. Oh, and if you've done HAZOP studies before, cross-check those too. Fresh perspective beats perfectionism every time.
Just treat human errors like equipment failures - add them as basic events in your fault tree. Break it down by cognitive stuff (info overload, time pressure), physical limitations, and organizational issues like crappy training or confusing procedures. Way too many FTAs completely skip the human side, which honestly drives me nuts. Don't just slap "operator error" on there and call it done. Get specific about failure modes and root causes. You can quantify this stuff using THERP or HEART data. The systematic approach really matters here - otherwise you're missing half the picture.
Man, FTA gets wild with complex systems. First off, figuring out where your system actually starts and ends is harder than it sounds. Dependencies turn into this tangled mess real quick. The fault tree grows into something absolutely massive - I've seen ones that are basically unreadable. Data's another headache since you rarely have solid failure rates for every single component. Oh, and good luck modeling human error or software bugs accurately with traditional methods. Honestly? Break it down into smaller pieces first. Focus on the failure modes that'll actually kill you.
So basically, FTA gives you the systematic hazard analysis that safety standards are looking for. Regulators want to see you've identified failure modes and actually quantified the risks - it's like showing your work in math class, but with way higher stakes. Aerospace, nuclear, automotive... they all pretty much require this documentation. The cool thing is it helps you figure out which safety measures are actually worth focusing on for compliance. Oh, and definitely keep your fault trees organized because auditors will dig into whether they tie back to specific requirements. Trust me on that one.
Dude, granular data makes or breaks your FTA. Generic stuff like "equipment failure" is totally useless - what're you supposed to do with that? You need the nitty-gritty details. Component-level failures, what conditions triggered them, environmental factors, all that good stuff. That's how you build trees that actually help with maintenance decisions instead of just looking pretty on paper. Oh and definitely collect data at the component level, not system level from the start. Way more bang for your buck there. The detail work pays off big time when you're trying to prevent the next failure.
Alright so there's a bunch of stuff you can pull from fault tree analysis. Main things are probability of your top event happening, component importance measures (criticality importance, Fubini importance - kinda nerdy names but whatever), and minimal cut sets. Cut sets show the smallest failure combos that'll break your system. Those are honestly gold for daily use. You'll also get reliability numbers and sensitivity results. My advice? Start with your highest probability cut sets and most critical components first. That's where fixing stuff actually moves the needle. The rest can wait.
So FTA basically shows you which failures would actually screw over your whole system. Map out those failure paths and you'll see your real critical points - then you know what deserves your attention vs what can wait. Honestly, I've watched teams burn hours on stuff that barely matters while ignoring the components that could tank everything. Focus your preventive maintenance on the high-criticality parts your fault tree identifies. Set up condition monitoring for those key failure modes. Oh, and start with whatever systems cost the most when they die - that's your biggest bang for the buck.
Dude, FTA totally changes how you make decisions - no more going with your gut when you've got actual data. The numbers show you which failures actually matter vs the ones that just freak you out. Honestly, seeing it all mapped out is pretty wild. You can run those "what if" scenarios before changing anything, which is clutch. Your boss will love the hard probabilities way more than you saying "this feels risky." I'd definitely use those fault tree results to pitch any safety upgrades. Makes the whole resource allocation thing so much clearer when you're not just guessing.
-
Excellent design and quick turnaround.
-
Informative presentations that are easily editable.