


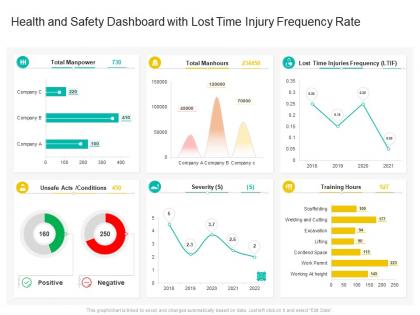
Health and safety dashboard with lost time injury frequency rate




Try Before you Buy Download Free Sample Product
 Impress Your
 Audience
 100%
100% Editable
 Save Hours
 of Time


Our Health And Safety Dashboard With Lost Time Injury Frequency Rate are topically designed to provide an attractive backdrop to any subject. Use them to look like a presentation pro.
People who downloaded this PowerPoint presentation also viewed the following :
Health and safety dashboard with lost time injury frequency rate with all 2 slides:
Use our Health And Safety Dashboard With Lost Time Injury Frequency Rate to effectively help you save your valuable time. They are readymade to fit into any presentation structure.

FAQs for Health and safety dashboard with lost time
So you need both types of metrics, honestly. The backwards-looking stuff is obvious - injury rates, lost time incidents, workers' comp costs. That's your "oops, already happened" data. But the real value comes from tracking things before accidents occur. Near-miss reports are huge because people actually tell you what almost went wrong. Also monitor safety training completion, audit scores, and maybe survey employees about safety culture - though surveys can be hit or miss depending on your crew. These leading indicators give you a heads up instead of just counting injuries after the fact.
So you take total incidents divided by hours worked, then multiply by 200,000 - that's the standard for 100 full-time workers. Don't stress about one bad month though. Trends matter way more than isolated spikes. Check if incidents are happening more in specific departments or shifts - that's your goldmine right there. Industry benchmarks are useful I guess, but honestly? The real value is digging into why each incident happened. Root causes tell the whole story. Focus on patterns and fix those systematically. Your safety program isn't broken just because you had a rough patch.
Your workers see the real deal every day, so their feedback is gold for understanding what's actually going wrong. They'll catch stuff you'd never notice from behind a desk - trust me on that. Plus when people feel heard, they're way more likely to report incidents honestly instead of just staying quiet. Without their input, you're basically flying blind with incomplete data. Yeah, it takes effort to collect and act on what they tell you, but that's how you build a safety program that actually works instead of one that just looks good on paper.
So leading indicators predict future safety stuff - like training hours, near-miss reports, hazard assessments. Lagging indicators show what already went wrong. Injury rates, workers' comp claims, that kind of thing. Most companies get obsessed with the lagging ones because they're easier to track. But honestly? That's backwards thinking. It's like only checking your rearview mirror while driving - you'll crash eventually. You want both, but lean heavy on the leading indicators. Use those to actually prevent problems. Then the lagging ones just confirm if your prevention stuff is working or not.
Track both your obvious stuff like incident rates and workers' comp claims, plus the predictive metrics - completion rates, test scores, supervisor observations. Employee feedback surveys are clutch too since they'll tell you if people actually absorbed anything or just zoned out. Honestly, I'd focus more on the leading indicators since they catch problems before someone gets hurt. Near-miss reports are gold if you can get workers to actually file them. Set up a simple dashboard with maybe 3-4 key metrics so you're not drowning in data.
Audits show you what's actually going wrong vs. what your current metrics claim is happening. You'll spot patterns and near-misses that aren't showing up in your regular data - honestly, half the time your KPIs are just making you feel better about things. The real value is using those findings to either fix your existing metrics or create new ones that matter. I'd also ditch any measurements that look good on paper but don't actually prevent incidents. Think of it like getting under the hood instead of just checking if your dashboard lights are green, you know?
First thing - find companies that actually match yours in size, industry, and risk level. OSHA logs and industry reports are your best bet for real data. The annoying part? Making sure you're comparing TRIR and DART rates fairly - some companies are way better at documenting incidents, which throws everything off. Honestly, I'd focus more on tracking your own trends against benchmarks over time rather than getting hung up on single snapshots. Set up quarterly check-ins to see where you stand. That way you can tweak your safety programs based on what's actually working.
You should definitely look into wearable sensors and mobile apps - they automatically track incidents and near-misses without people having to remember to fill out forms. Way more accurate than manual stuff. The analytics side is pretty cool too, honestly - it can spot patterns before things go wrong. IoT devices are great for monitoring environmental conditions in real-time. Just don't try to do everything at once though. Pick one thing like incident reporting first, let your team get used to it, then add more features. Makes sure whatever you choose plays nice with what you're already using.
Don't fall into the trap of only tracking stuff like injury rates after things go wrong. Leading indicators are where it's at - they actually help you prevent problems before they happen. Most places go overboard and pick like 15 different metrics, which is honestly just overwhelming for everyone. Setting crazy unrealistic goals is another big one. Zero incidents overnight? Come on. Also, if your metrics don't match where your actual risks are, you're basically shooting in the dark. Oh and definitely get your frontline people involved in choosing these - they know what actually matters day-to-day. Keep it simple with maybe 3-5 good ones that mix both types.
Okay so here's the thing - you've gotta connect your safety numbers to stuff leadership actually gives a damn about. Revenue, compliance, whatever keeps them up at night. Map out how accidents mess with business results first. Then pick KPIs that show both safety AND business impact. Like if injuries tank your production, track both incident rates and lost hours. Don't just look backward either - get some forward-looking indicators in there too. Honestly, executives tune out unless they see metrics they already care about. Pick maybe 4-5 solid ones that tell a clear story and stick with reporting those consistently.
Dude, real-time tracking is honestly amazing for safety stuff. You can catch problems as they're happening instead of finding out weeks later through some boring monthly report. Think of it like... having early warning alerts before things go sideways. When your safety numbers start dropping, boom - you know instantly and can actually do something about it. Way better than discovering issues after someone's already gotten hurt, you know? I'd start with whatever your biggest safety concerns are and set up automatic monitoring for those first. The whole "crystal ball" thing sounds cheesy but it's kinda true.
Honestly, making safety metrics visible to everyone is a game changer. Track stuff like near-misses, training completions, days without incidents - then actually post the numbers where people can see them. Your team starts feeling like they're part of it instead of just following rules. We did department competitions at my last job and it was surprisingly motivating (way better than those cheesy pizza parties). Talk about the numbers in meetings too. Short bursts work better than long safety speeches. Once people see their actions matter, they stop treating safety like busy work and actually care about it.
Honestly, I'd start with the obvious stuff - engagement scores, how often people call out sick, and turnover rates. Those give you the real picture. Anonymous surveys are gold though, people actually spill when they're not worried about getting in trouble. Track stress-related sick days too, and see if anyone's using your mental health programs (assuming you have them). Exit interviews can be super telling if you look for patterns. The thing is, don't go crazy with like 15 different metrics. Pick 2-3 you can actually do something about and combine that with just talking to people regularly.
Hey! So basically you track stuff regulators actually check - incident rates, near-misses, training records, audit results. Map what you're measuring against your specific requirements first (that's honestly the most crucial step). Set baselines, then targets that beat the minimums. Regular reporting keeps you on track. The whole point is catching problems before inspectors do - nobody wants nasty surprises during audits, right? Use your data to spot trends early. I'd focus on being proactive rather than just reactive. Makes compliance way less stressful when you're ahead of issues instead of scrambling to fix violations after the fact.
Dude, you're basically making decisions in the dark without good data. Can't tell if your safety stuff is actually working or just looks good on paper. Missing trends, wasting money on the wrong things - it's a mess. Like my old boss who kept buying fancy equipment while ignoring the obvious slip hazards everywhere. You'll never know where real problems are hiding. Track your incident rates and near-misses at minimum. Otherwise you're just guessing and hoping nothing bad happens.
-
Great quality slides in rapid time.
-
Great product with highly impressive and engaging designs.