"An ounce of prevention is worth a pound of cure."
- Benjamin Franklin, Founding Father of the United States
In the dynamic realm of data security, Benjamin Franklin's timeless wisdom holds true. In today's digital age, where information flows ceaselessly across borders and cyber threats are more sophisticated than ever before, a proactive approach to safety and security is not just advisable; it's a categorical necessity. To protect your organization's critical data and digital infrastructure, a well-structured safety dashboard is an indispensable tool.
Whether you are a seasoned safety professional seeking to bolster your organization's security measures or a business leader intent on safeguarding your company's assets, our carefully curated Safety Dashboard Templates are invaluable resources.
These templates not only save you time and effort but also ensure that your organization is equipped with the latest safety protocols and compliance standards, enabling you to navigate the ever-changing safety landscape with confidence. Additionally, when it comes to safeguarding your organization's digital assets, a well-structured Safety Dashboard with essential Security Indicators is indispensable.
Explore our collection of Top 10 security dashboard templates that can assist you in creating visually compelling security dashboards, ensuring your data is secure and protected.
In the following sections, we will explore each of these must-have safety dashboard templates, which are content-ready, available in user-friendly formats, and can be customized to suit your specific needs.
Template 1: Elucidating the Workplace Safety Dashboard to Monitor Incidents Template
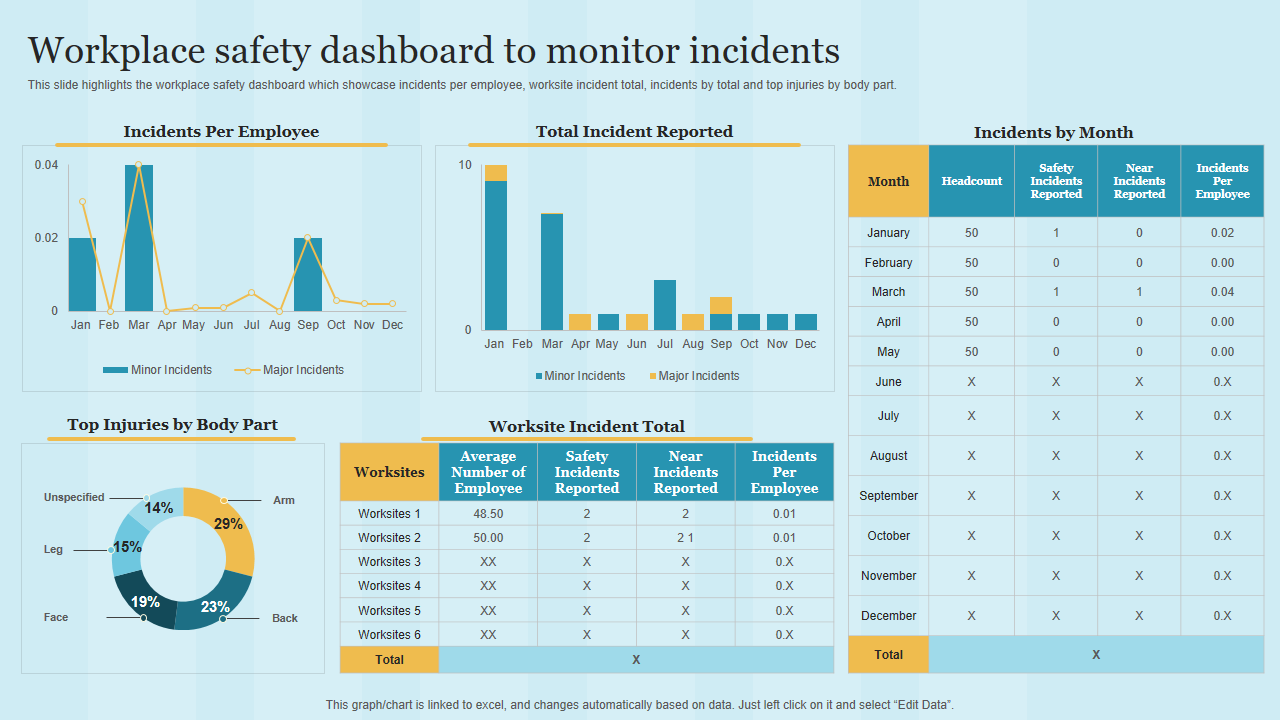
This template is a vital tool for monitoring and improving workplace safety. It presents key Organization Safety Metrics, including incidents per employee, worksite incident totals, incidents by type, and top injuries by body part. Dive deeper into this template to effectively Monitor Incidents and Uphold Health and Safety Standards. It serves as an invaluable resource for discussions and navigation through Total Incident Reported, Worksite Incident Totals, and the ongoing monitoring of incidents.
Download Now to Transform Your Defense!
Template 2: Exploring the Health and Safety Dashboard Template
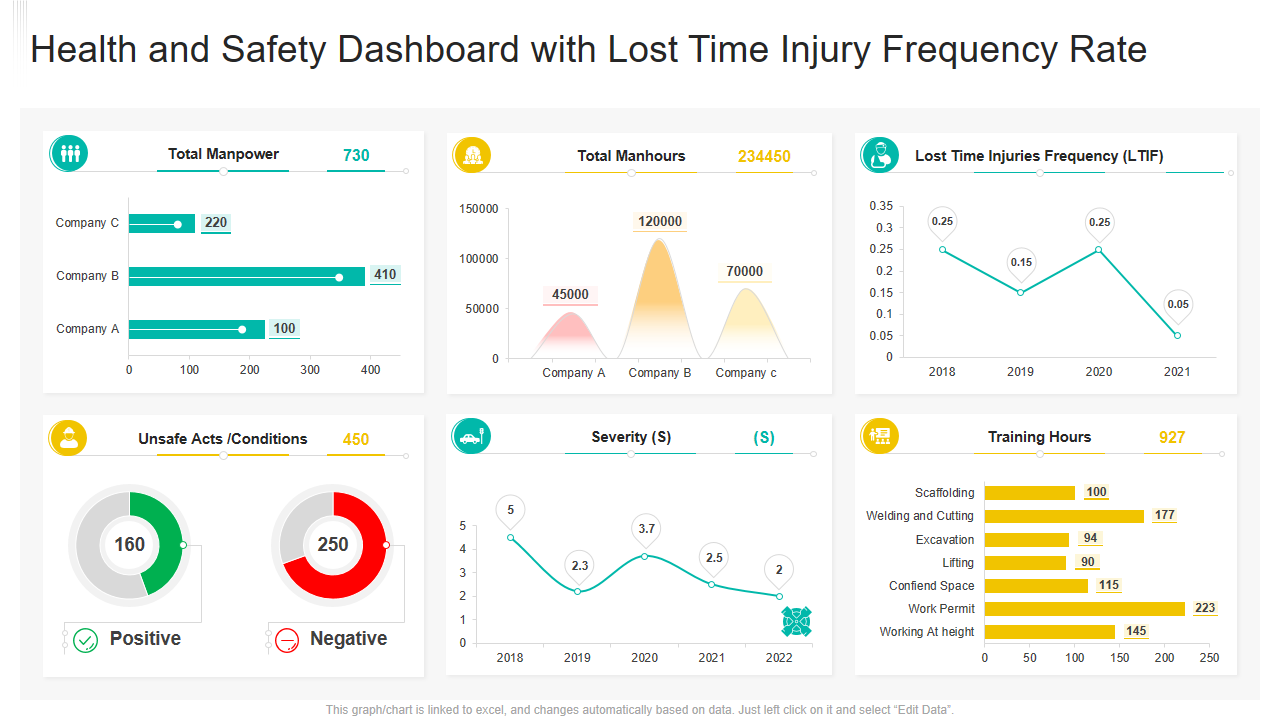
These PPT Slides offer a comprehensive view of health and safety within your organization, focusing on vital aspects such as Severity, Total Manpower, and the frequency of Lost Time Injuries.
This is not just a static presentation; it's a dynamic resource that caters to your specific audience and organizational needs. It empowers you to convey the significance of Security Indicators and the importance of maintaining a safe workplace environment effectively.
Using this PPT Set, you can track the frequency of Lost Time Injuries, evaluate their severity, and assess their impact on your workforce. It's a powerful tool to engage and educate your audience, whether it's your safety team, management, or the broader organization.
Download it now to create your organization's success.
Template 3: Presenting the Covid-19 Health and Safety Dashboard with Cumulative Test Results Template
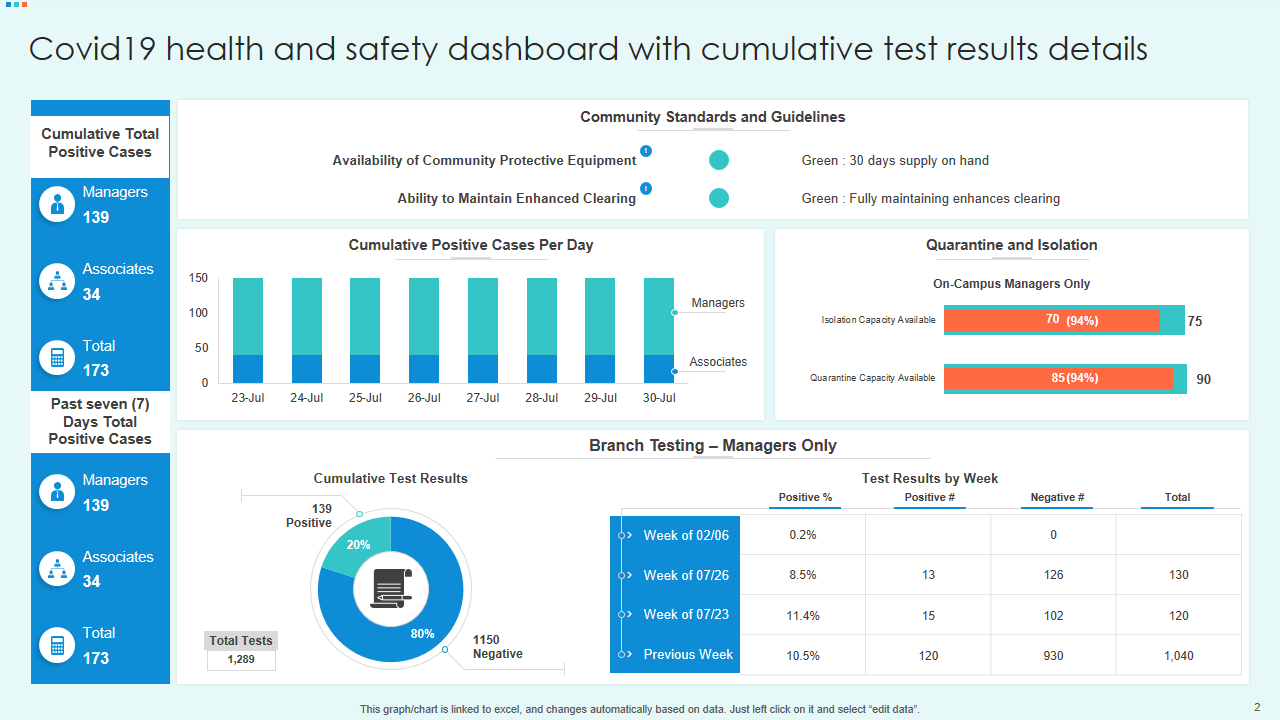
This slide provides detailed insights, including Cumulative Total Positive Cases analysis for different designations such as managers and associates on the subject of COVID-19. Additionally, it highlights adherence to Community Standards and Guidelines, encompassing the availability of Community Protective equipment and the ability to maintain enhanced cleaning. The dashboard further offers Branch Testing data for managers from various branches on a week-by-week basis and furnishes information about quarantine and isolation.
Don't wait! Download here to access this invaluable Safety Dashboard for monitoring health and safety in your organization.
Template 4: Unveiling the Injury Classification Dashboard for Health and Safety Template
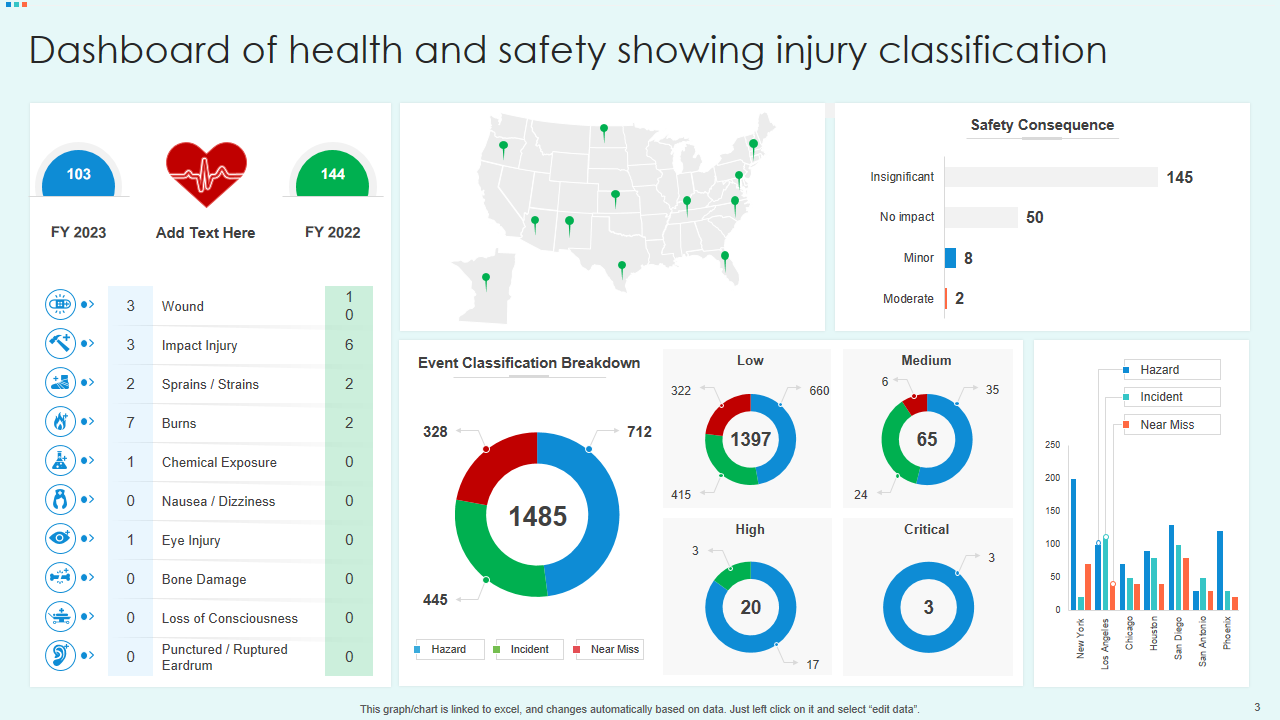
This illustration introduces a dashboard focused on Injury Classification. It categorizes employee injuries into various types, such as Insignificant, Impact Injury, Hazard, Sprains/Strains, Incident, Burns, Chemical Exposure, Nausea / Dizziness, Critical, Eye Injury, Bone Damage, Loss of Consciousness, and Punctured/Ruptured Eardrum.
Additionally, it facilitates the comparison of injury reports and records across different financial years. Enhance your safety standards now!
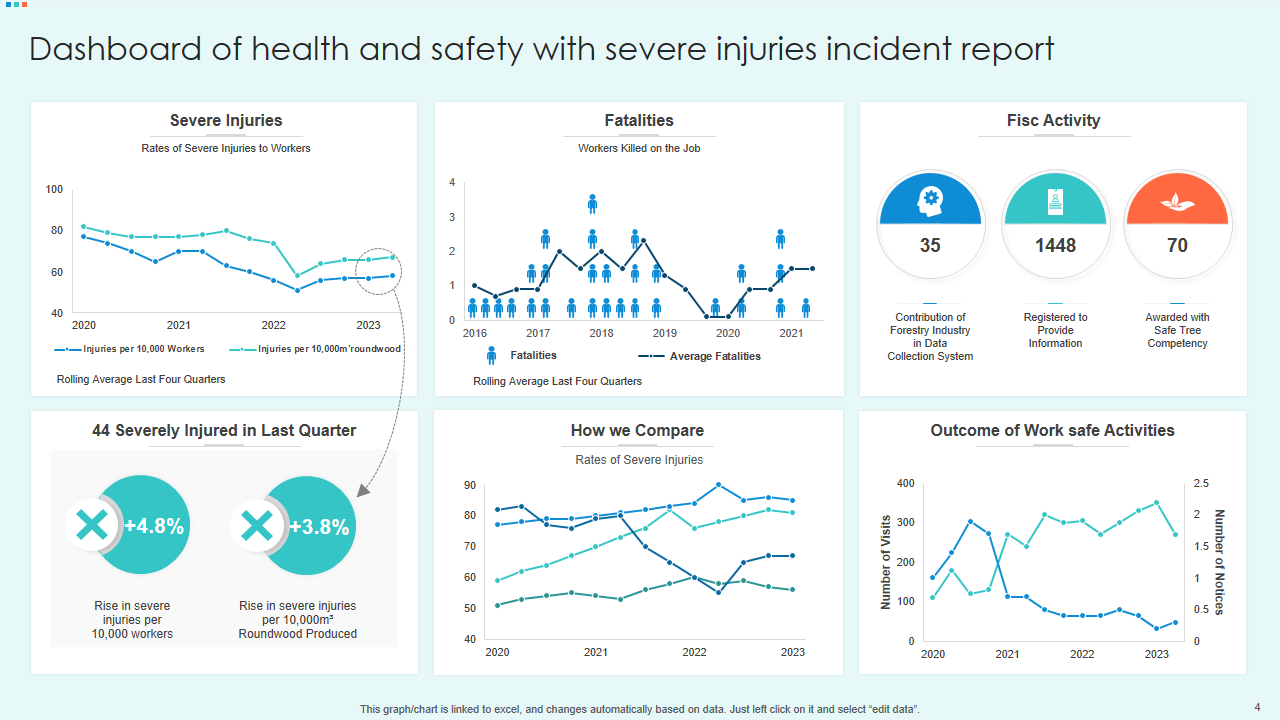
Template 5: Revealing the Dashboard of Health and Safety for Severe Injuries Incident Reporting Template
This slide presents a Dashboard highlighting severe Injuries and their reporting. It includes critical data on Fatalities, Fiscal Activity, Severe Injuries, Workers Killed on the job, Average Fatalities, Rolling Average Last Four Quarters, Ring Average Last Four Quarters, Outcome of Work Safe Activities, etc. This data presented visually will be better received and understood with this slide.
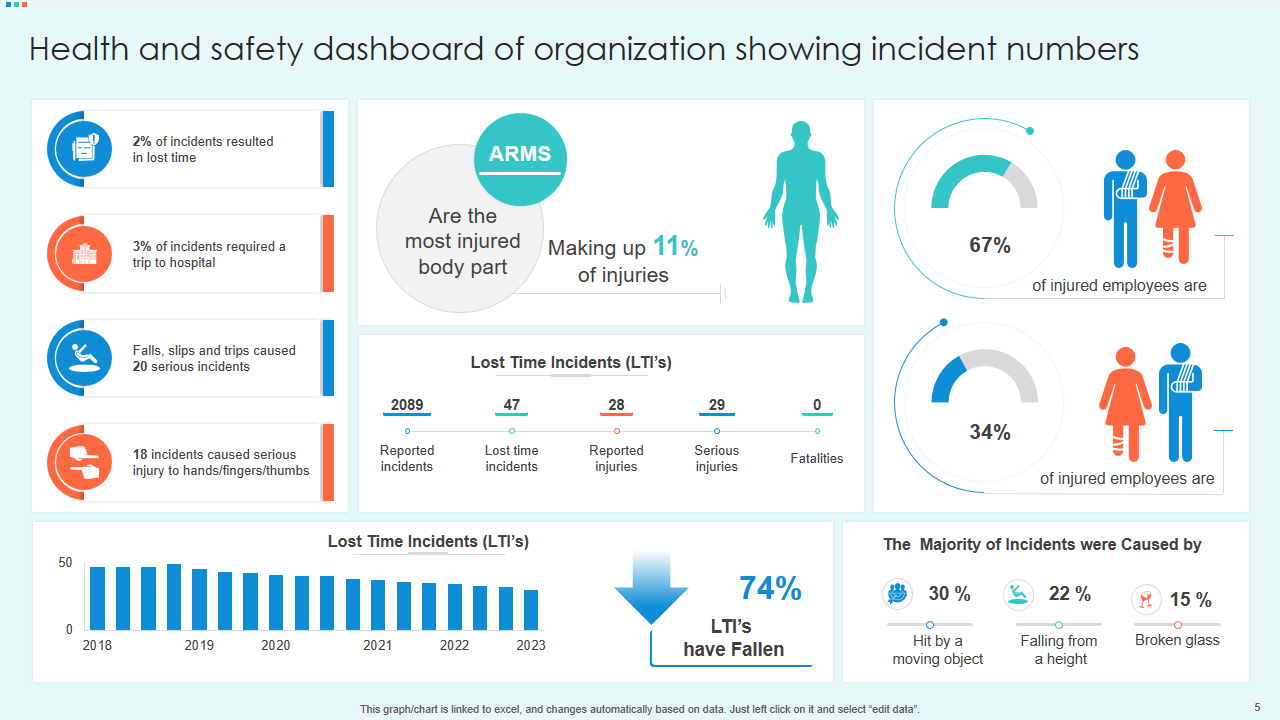
Template 6: Delving into the Health and Safety Incident Numbers Dashboard Template
This slide showcases critical metrics like the percentage of Incidents Resulted in Lost Time, Most Injured Body Part, percentage of Incidents Requiring a Trip to Hospital. Additionally, you can also enter data on Number of Falls, Slips, and Trips Causing Serious Incidents, Reported Incidents, Reported Injuries, percentage of Injured Employees with Serious Injuries and Fatalities, and statistics about Lost Time Incidents (LTIs).
Obtain it for tracking incidents related to health and safety.
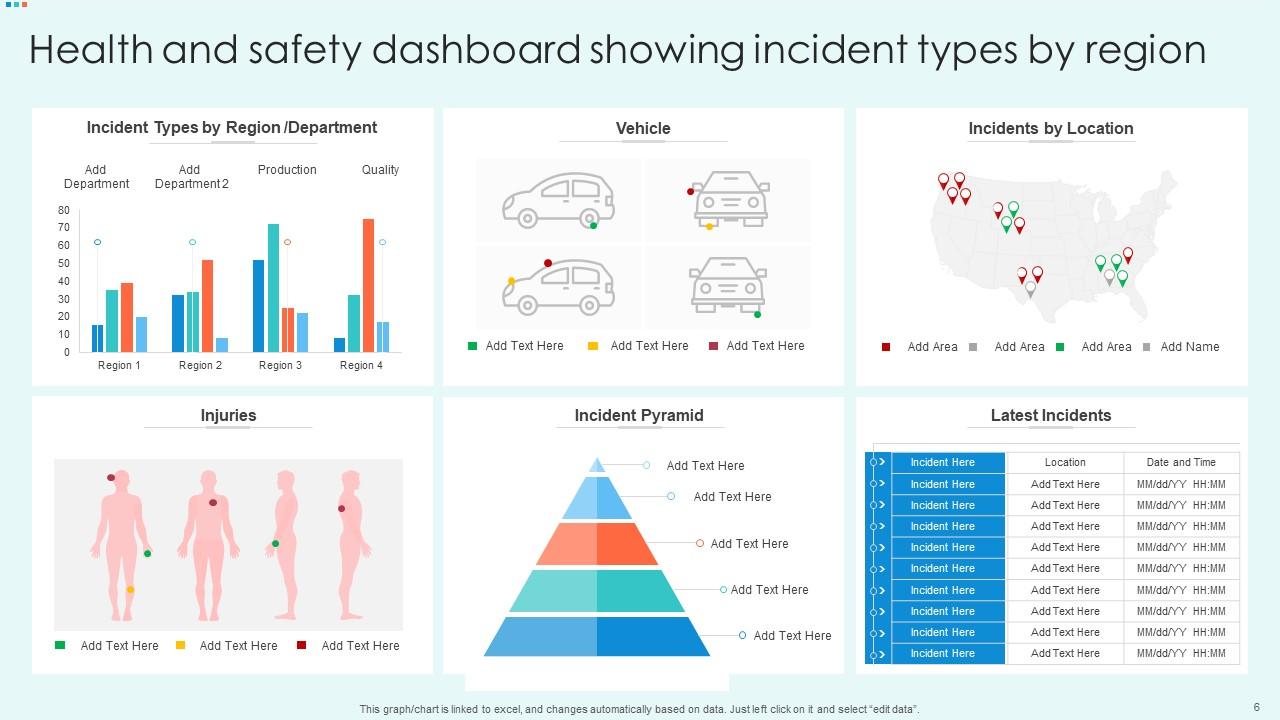
Template 7: Unraveling the Health and Safety Dashboard Showing Incident Types by Region Template
This template comes with a dashboard providing insights into various incident types categorized by Region/Department and Vehicle, as well as incidents by location and department. It includes a table displaying location, date, and time details for each incident. You can now get it with just one click.
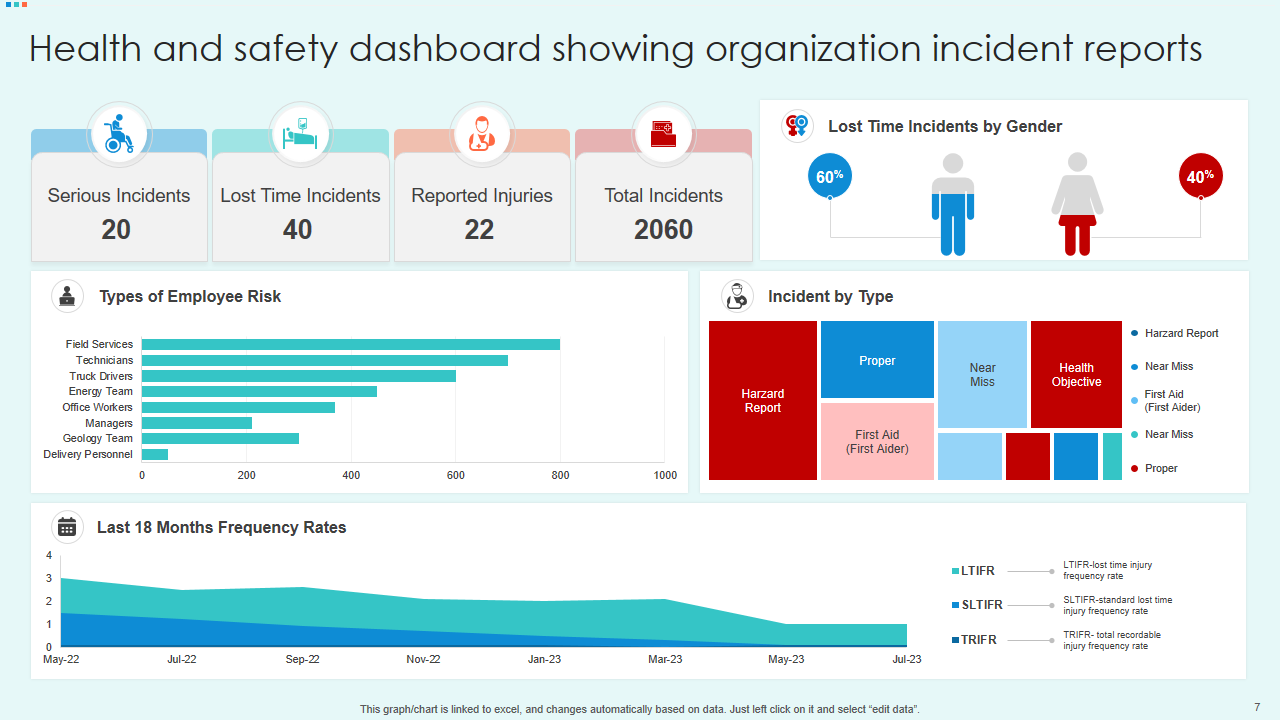
Template 8: Articulating the Organization Incident Reports on Health and Safety Dashboard Template
This slide presents data on Lost Time Incidents by Gender, Serious Incidents, Lost Time Incidents, Number of Reported Injuries, Cumulative Number of Total Incidents, Types of Employee Risk based on designations such as Technicians, Truck Drivers, Energy Team, Office Workers, Managers, and more.
It also covers Incident by Type like Hazard Reports, Near Misses, and First Aid required, along with data for the Last 18 Months Frequency Rates.
Stay Informed About Organization Incidents!
Template 9: Presenting the Incidents with Lost Time on Health and Safety Dashboard Template
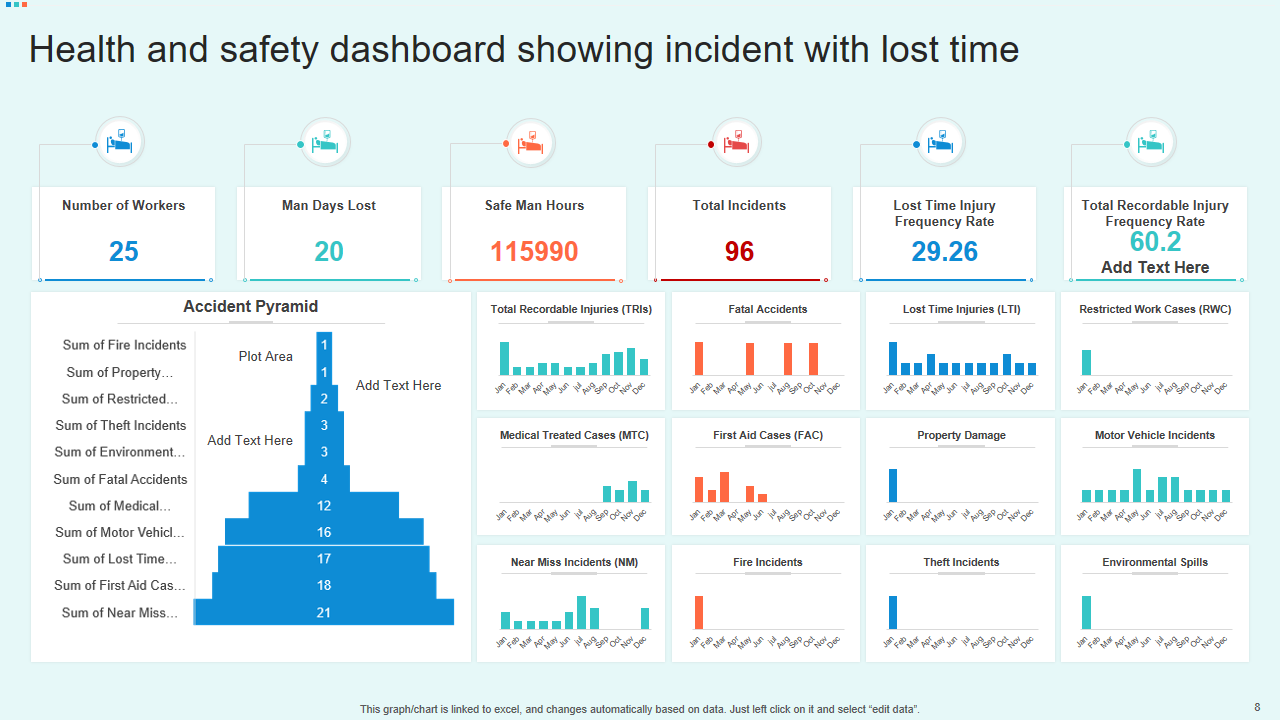
This slide reveals a list of key metrics such as Number of Workers, Man Days Lost, Total Incidents, Lost Time Injury Frequency Rate, Total Recordable Injury Frequency Rate, and more. It also features an Accident Pyramid showing various incident categories and Safe Man Hours.
Template 10: Previewing the Injuries with Accidents Records on Health and Safety Dashboard Template
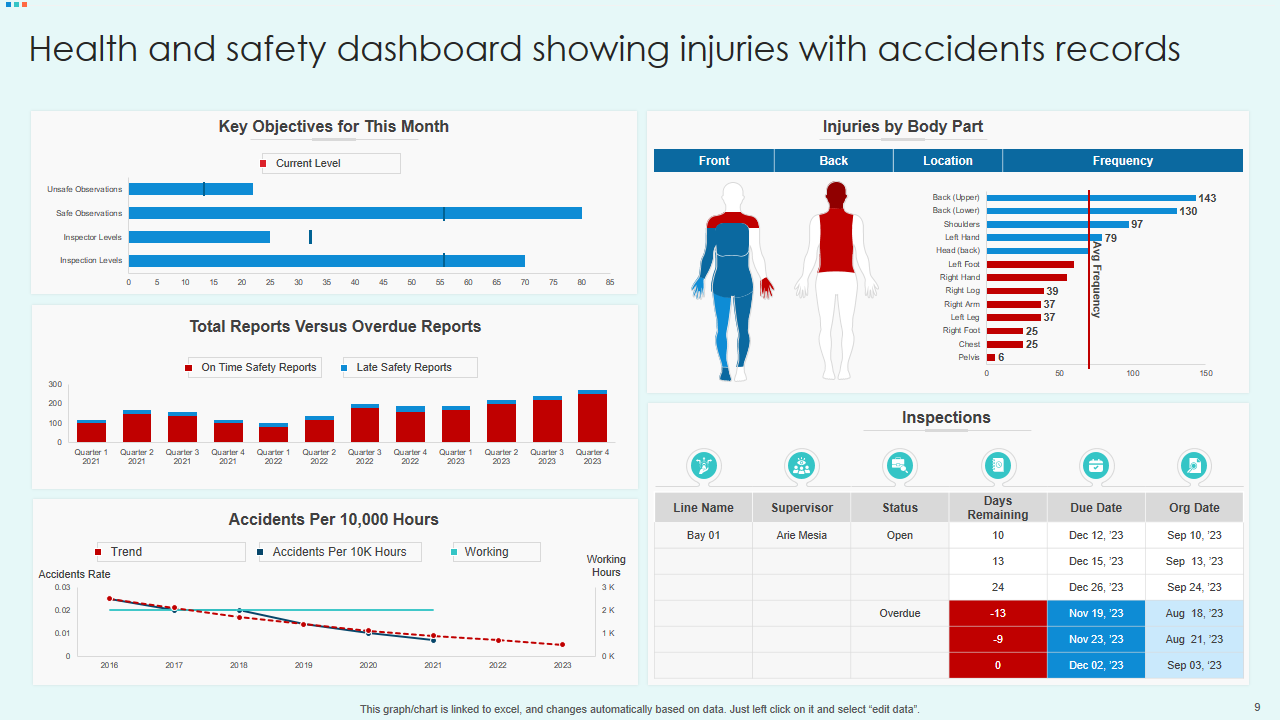
This slide showcases a Dashboard that highlights Injuries with Accident Records. It includes key objectives for the month, insights into injuries by body part (front or back), and details about total reports versus overdue reports. Additionally, it presents data on on-time safety reports, late safety reports, and information about inspections, including line names, supervisor names, and status. The dashboard also provides data on accidents per 10,000 hours.
Elevate safety standards! Download here
Template 11: Presenting the Lost Time Injury Frequency Rate on Health and Safety Dashboard
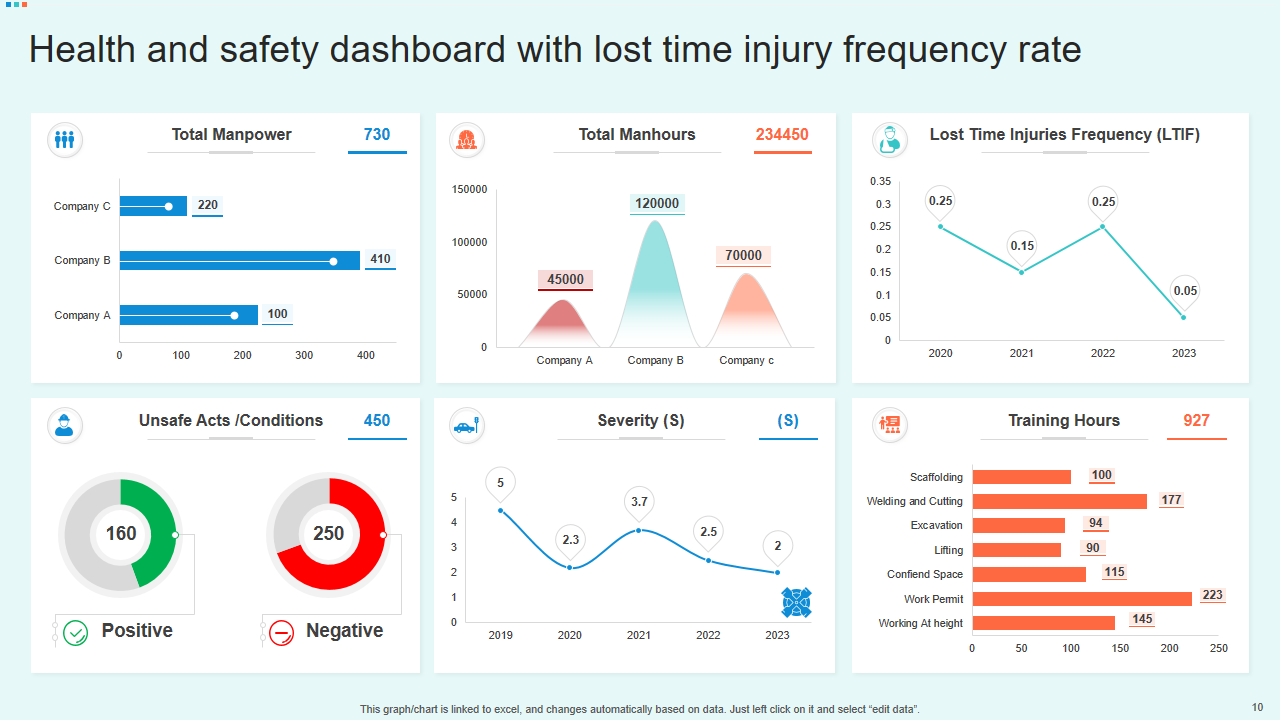
This slide presents a dashboard featuring the Lost Time Injury Frequency Rate. It includes a list of Total Manpower within the company, Total Manhours, Lost Time Injuries Frequency (LTIF), data on Unsafe Acts/Conditions, and hours of Training for different activities. You can make it yours with just a click!
Enhance Safety Practices! Download now
Template 12: Unveiling the Patient Satisfaction on Health and Safety Dashboard Template
This template focuses on Patient Satisfaction. It includes key metrics such as Patient Satisfaction in percentage, a tabular survey report indicating if staff provided information in a well-mannered manner, details about laboratory tests and their target times, and percentages indicating whether proper care was taken by staff members.
Improve Patient Satisfaction! Download today.
Conclusion
The cornerstone of safeguarding your organization's critical data and digital infrastructure is the implementation of a well-structured safety dashboard. Our collection of Safety Dashboard Templates, curated for both seasoned safety professionals and business leaders, stands as invaluable resources. These templates not only save time and effort but also ensure that your organization stays up-to-date with the latest safety protocols and compliance standards. They empower you to navigate the ever-changing landscape of safety with unwavering confidence.
Throughout this article, we have explored each of these must-have safety dashboard templates, accompanied by real-world examples and samples that shed light on their purpose and implementation. These templates are thoughtfully designed to be highly adaptable to suit your organization's specific needs.
The Safety Plan Templates with Examples and Samples guide offers insights into crafting meticulous safety plans and emphasizes the importance of Organization Safety Metrics, providing customizable templates and samples.
Meanwhile, the article on Top 10 HR Dashboard Templates with Examples and Samples explores HR dashboards and underscores the integration of safety and health metrics into HR and safety initiatives.
FAQs on Safety Dashboard
What is a safety dashboard?
A safety dashboard is a visual representation of key safety and security indicators and metrics within an organization. It serves as a centralized tool to monitor, analyze, and present critical information related to health KPIs and safety in the workplace. Safety dashboards provide real-time or periodic insights into an organization's safety performance and help stakeholders make informed decisions to improve safety practices.
How to make a safety dashboard?
Creating an effective safety dashboard involves several steps:
- Define Objectives: Clearly outline the goals and objectives of your safety dashboard. Determine what specific safety metrics, health KPIs, or security indicators you want to track.
- Data Collection: Gather relevant data from various sources within your organization. This may include incident reports, workplace inspection records, employee training data, and security incident logs.
- Select Key Metrics: Choose the most crucial safety metrics and health KPIs that align with your objectives. Common metrics might include injury rates, incident severity, near misses, and compliance with safety regulations.
- Choose Visualization Tools: Select the appropriate visualization tools for your safety dashboard. Common choices include bar charts, line graphs, pie charts, and heatmaps. Ensure that the chosen visuals effectively communicate the data.
- Design the Dashboard: Use software tools or platforms like Excel, Tableau, or dedicated safety dashboard software to design your dashboard. Organize the selected metrics and indicators logically, and ensure the dashboard is user-friendly.
What is a KPI in safety?
A KPI, or Key Performance Indicator, in safety refers to a quantifiable measure used to evaluate an organization's safety performance. These indicators help organizations track their progress in achieving safety goals and objectives. KPIs in safety often include metrics such as injury rates, incident severity, near-miss reports, safety training completion rates, and compliance with safety regulations. These KPIs provide a clear picture of an organization's safety performance and guide efforts to improve workplace safety.
What are some safety metrics?
Safety metrics are specific measurements used to assess and quantify various aspects of safety within an organization. Here are some common safety metrics:
- Lost Time Injury Rate (LTIR): The number of workdays lost due to injuries per 100 full-time employees.
- Total Recordable Incident Rate (TRIR): The total number of recordable incidents (injuries, illnesses, and near-misses) per 100 full-time employees.
- Severity Rate: Measures the severity of injuries and incidents by assigning values based on their impact.
- Near-Miss Reporting Rate: The number of near-miss incidents reported compared to the total number of incidents, providing insights into potential hazards.
- Safety Compliance Rate: The percentage of employees or departments that comply with safety regulations and procedures.


 Customer Reviews

