


Plantilla total




Try Before you Buy Download Free Sample Product
 Impress Your
 Audience
 100%
100% Editable
 Save Hours
 of Time


Métricas de nuestro panel de recursos humanos con el total de personal están diseñadas temáticamente para proporcionar un fondo atractivo a cualquier tema. Úsalas para parecer un profesional de las presentaciones.
People who downloaded this PowerPoint presentation also viewed the following :
Contenido de esta presentación de Powerpoint
Descripción:
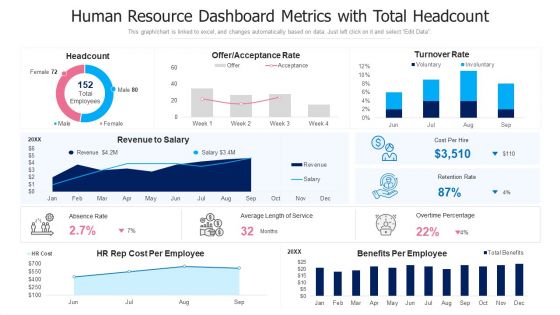
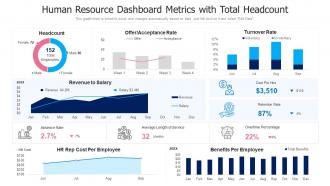
La imagen es una diapositiva de PowerPoint titulada "Métricas del Tablero de Recursos Humanos con Número Total de Empleados". Es una representación visual completa de varias métricas y análisis de recursos humanos para una organización. La diapositiva incluye varios gráficos e indicadores:
1. Número de empleados:
Un gráfico de anillos que muestra el número total de empleados, divididos por género, con 80 empleados masculinos y 72 empleados femeninos, totalizando 152 empleados.
2. Tasa de oferta/aceptación:
Un gráfico de líneas que muestra el seguimiento semanal de las ofertas de trabajo realizadas y aceptadas durante cuatro semanas, indicando la tasa de éxito de los esfuerzos de reclutamiento.
3. Tasa de rotación:
Un gráfico de barras que detalla las tasas de rotación voluntaria e involuntaria para los meses de junio a septiembre.
4. Ingresos frente a salarios:
Un gráfico de áreas que compara los ingresos mensuales con los gastos salariales, con cifras específicas dadas para los ingresos ($4.2M) y los salarios ($3.4M).
5. Costo por contratación:
Un icono con un valor de $3,510, mostrando una disminución de $110 respecto a la cifra anterior.
6. Tasa de retención:
Mostrada como 87%, con una disminución del 4% respecto a un período anterior.
7. Porcentaje de horas extras:
Ilustrado como 22%, también mostrando una disminución del 4%.
8. Tasa de ausentismo:
Listada como 2.7%, con una disminución del 7%.
9. Duración promedio del servicio:
Un icono que indica un promedio de 32 meses.
10. Costo del representante de RR.HH. por empleado:
Un gráfico de líneas que muestra la tendencia del costo de representación de RR.HH. por empleado durante un período de junio a septiembre.
11. Beneficios por empleado:
Un gráfico de barras que muestra el costo total de beneficios por empleado distribuido mensualmente de enero a diciembre.
La diapositiva también menciona que el gráfico/gráfico está vinculado a Excel y puede cambiar automáticamente según los datos, lo que sugiere que se puede actualizar de forma interactiva.
Métricas del panel de recursos humanos con el total de personal con todas las 2 diapositivas.
Utilice nuestras métricas del panel de control de recursos humanos con el total de personal para ayudarlo a ahorrar tiempo valioso. Están listas para adaptarse a cualquier estructura de presentación.
FAQs for Human resource dashboard metrics
Track these five: turnover rate, time-to-fill, engagement scores, absenteeism, and cost-per-hire. Start with just turnover and engagement though - they'll tell you if things are going sideways before everything else does. Most teams waste time tracking like 20+ metrics that don't actually matter. These five cover the important stuff: who's leaving, how fast you're hiring, if people are happy, productivity red flags, and what you're spending. Oh, and track them monthly once you figure out your baseline numbers. Way better than drowning in spreadsheets that nobody reads anyway.
Honestly, the data takes all the guesswork out of it. Instead of just hoping your hiring process works, you'll actually see the numbers. Turnover trends become obvious. Training gaps? Super clear which departments are struggling. I started tracking just 3-4 metrics monthly and it made such a difference when I had to ask for more budget - way easier to convince leadership when you've got actual proof. The whole "going with your gut" thing sounds nice but it's kinda useless when you're trying to plan ahead or figure out staffing needs.
Yeah, engagement metrics are solid for predicting turnover - think of them as your early warning system. Dropping survey scores, people skipping company events, less collaboration... that's someone checking out mentally before they bail physically. You can usually spot the pattern 6-8 weeks before they actually quit, which is honestly pretty useful timing. Not everyone with low engagement leaves immediately, but it definitely tells you who's at risk. I'd match up your engagement data with exit interviews to see which metrics actually matter most for your specific team.
Honestly, you need both the quick wins and long-term stuff. Get reaction scores right after training, then do knowledge checks or certifications later. But here's what really matters - are people actually using what they learned? That's where you look at performance metrics, productivity, retention rates between trained vs untrained folks. ROI calculations are useful but kinda messy with soft skills. Manager feedback is huge too, plus promotion rates. Oh, and set this all up BEFORE you launch - trust me, hunting for data afterwards sucks. The behavior change piece is really where you'll see if it worked.
So definitely start with time-to-fill and cost-per-hire - they're super straightforward to calculate and will show you where things are getting stuck. Quality of hire is huge too (basically how well new people perform after 6-12 months). Honestly, I'm obsessed with offer acceptance rates because they tell you everything about whether your brand and pay are actually competitive. Track which sources bring your best candidates - some channels are total garbage. Oh, and candidate experience surveys if you can swing it, though that's more of a nice-to-have. Those first two metrics will give you the biggest bang for your buck right away.
Honestly, most companies mess this up by tracking everything but acting on nothing. Pick 3-4 metrics that actually connect to your business - representation across levels, pay gaps, retention by demographics. Monthly tracking works best. Here's what really matters though: tie the results directly to leadership reviews and comp. Otherwise it's just pretty dashboards nobody cares about. Set real targets like "15% more underrepresented folks in management this year" instead of that wishy-washy "we value diversity" stuff. Treat D&I data exactly like you'd treat revenue metrics - visible, actionable, with consequences.
First thing - figure out your key metrics like turnover rates, how long hiring takes, and engagement scores. Check SHRM, Glassdoor, or those HR consulting reports for industry data. But honestly, generic benchmarks are pretty worthless unless you're comparing similar companies - same size, industry, location, all that. Track your own numbers consistently first, then do the external comparison thing. The real value is understanding why there are gaps, not just staring at spreadsheets. I'd probably do quarterly check-ins to update your benchmarks and tweak targets as needed.
Look, performance measurement hits your bottom line because it shows you who's actually driving results vs just showing up. You want to connect individual metrics to company goals - like sales numbers to revenue or customer service scores to retention. That way you can spot your top performers and figure out who needs help. Honestly, most companies measure the wrong stuff anyway. Don't just track busy work. Map out what your best people actually do and see what correlates with wins. It's about connecting daily work to whether your business succeeds or tanks.
Honestly, just get an HRIS like Workday or BambooHR - they'll track turnover, performance, all that stuff automatically. Excel's fine if you're starting out, but trust me, you'll hate yourself later trying to manage everything manually. Culture Amp is solid for employee surveys, though it's pricey. For presentations to the big bosses, Tableau makes everything look way more professional than it probably is. Oh, and make sure whatever you pick plays nice with your payroll system - learned that one the hard way. Start small, figure out what you actually need to measure, then build from there.
So you basically want to map what skills people actually have vs what they need, right? Performance reviews are super telling - look at where scores consistently drop. Training requests are honestly my favorite metric because people literally tell you what they're missing. Also check if you're always hiring externally for the same roles - that screams internal skill gap. Internal promotion patterns matter too. Are people getting stuck at certain levels? Start with future business needs, then work backwards through your performance data. It's like detective work but with spreadsheets instead of clues.
Ugh, data accuracy is such a pain but totally fixable! First thing - get your team doing regular validation checks and make everyone enter stuff the same way. Seriously, standardized formats will save your sanity. Set up those automated alerts for weird stuff and make two people sign off on big changes like headcount or pay adjustments. I'd also do quarterly audits to catch problems early. Oh, and create actual policies around data governance - sounds boring but it works. The trick is building these checks into your normal routine instead of scrambling when reports are due.
I'd say quarterly minimum, but honestly monthly works better if you're growing fast. Look for red flags like turnover jumping up suddenly or engagement tanking. Missing hiring goals consistently? That's another one. The thing that gets overlooked - when executives start asking stuff your current metrics can't even answer. Super common actually. Exit interviews revealing problems your data missed is a big tell too. Or maybe business priorities changed but you're still tracking the same old stuff. Just start by comparing what you measure now against what actually matters to your company today.
Honestly, the hardest part is making HR data actually mean something to people who don't live and breathe this stuff. Like, you can't just say "turnover is up 15%" and expect anyone to care. What they want to know is how that's hitting their bottom line or screwing with productivity. Your CEO wants the big picture strategy talk, but your managers? They need the day-to-day operational stuff they can actually do something about. Most HR metrics are pretty dry anyway - I mean, who gets excited about retention rates? The trick is telling a story with your numbers. Connect it to problems they're already losing sleep over, ditch the boring spreadsheets for something visual, and always start with why it matters before you dump the data on them.
So predictive analytics flips your HR data from just looking backward to actually seeing what's coming. You know how you'd normally just notice turnover was bad last quarter? Now you can spot who's about to bail and actually do something about it first. Pretty cool stuff - forecasting hiring needs, catching performance problems early, identifying people who might leave. Honestly feels like having a crystal ball sometimes. I'd say pick one thing you're already tracking well and start there, then expand once you get the hang of it.
Think of satisfaction metrics as your radar for spotting trouble before people ghost you for new jobs. Track engagement scores and retention rates - they'll show you what's really going down versus what looks good in company presentations. Exit interviews are honestly pretty useless since people sugarcoat everything on their way out. The cool thing is you can catch patterns early, like maybe one team's manager is driving everyone crazy or that new policy backfired hard. Don't just throw pizza parties at problems though. Use the actual data to fix what's broken instead of guessing.
-
Awesome use of colors and designs in product templates.