


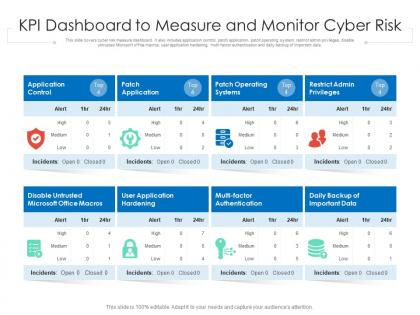
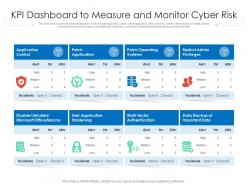
Kpi dashboard to measure and monitor cyber risk


Try Before you Buy Download Free Sample Product
 Impress Your
 Audience
Editable
of Time


Our KPI Dashboard To Measure And Monitor Cyber Risk are topically designed to provide an attractive backdrop to any subject. Use them to look like a presentation pro.
People who downloaded this PowerPoint presentation also viewed the following :
Kpi dashboard to measure and monitor cyber risk with all 2 slides:
Use our KPI Dashboard To Measure And Monitor Cyber Risk to effectively help you save your valuable time. They are readymade to fit into any presentation structure.

FAQs for Kpi dashboard to measure and
Critical cyber risk KPIs include threat detection time, incident response duration, vulnerability remediation rates, security awareness training completion, and compliance audit scores. These metrics enable organizations to monitor their security posture comprehensively, with many financial institutions and healthcare providers finding that tracking these KPIs simultaneously enhances operational efficiency, reduces potential breach costs, and delivers measurable competitive advantage.
Organizations prioritize cyber risks using KPI dashboards by categorizing threats based on severity scores, potential business impact, likelihood of occurrence, and regulatory compliance requirements. These dashboards enable security teams to allocate resources strategically, focus on high-priority vulnerabilities first, and track remediation progress across departments, ultimately delivering faster incident response and enhanced organizational resilience.
Essential data sources include security information and event management (SIEM) systems, vulnerability scanners, threat intelligence feeds, network monitoring tools, and incident response platforms. These systems streamline risk assessment by collecting real-time security events, identifying system weaknesses, and tracking threat patterns, with many organizations finding that integrated data sources ultimately deliver more accurate risk visibility and faster incident response capabilities.
Cyber risk dashboards should be updated in real-time for critical threat indicators, with comprehensive reviews conducted daily or weekly depending on organizational risk tolerance and industry requirements. Financial institutions and healthcare organizations often implement continuous monitoring with hourly updates, while other sectors may find daily refreshes sufficient, ultimately enabling faster incident response, improved threat visibility, and more agile security decision-making.
Historical data serves as the foundation for establishing baseline metrics, identifying trend patterns, setting realistic benchmarks, and calibrating risk thresholds in cyber risk KPIs. Through analysis of past incidents, organizations can predict vulnerability windows, optimize resource allocation, and enhance threat detection capabilities, with many financial services and healthcare institutions finding that historical patterns significantly improve their proactive cybersecurity positioning.
Real-time monitoring enhances cyber risk dashboards by providing immediate threat detection, continuous vulnerability assessment, and instant incident response capabilities, enabling security teams to identify and address risks before they escalate. Through automated alerts and live data feeds, organizations can streamline their security operations, minimize response times, and maintain proactive defense postures, ultimately delivering enhanced protection and operational resilience.
Effective cyber risk KPI visualizations include heat maps for vulnerability assessments, trend lines for incident patterns, gauge charts for risk scores, traffic light indicators for security status, and geographic maps for threat locations. These techniques enable security teams to quickly identify critical vulnerabilities, track emerging threats, and communicate risk levels to executives, ultimately delivering faster incident response and more strategic cybersecurity resource allocation.
Compliance requirements directly shape cyber risk KPIs by mandating specific metrics like incident response times, data breach notifications, access control audits, and vulnerability remediation rates. These regulatory frameworks, particularly in sectors like banking, healthcare, and financial services, enable organizations to demonstrate adherence while enhancing security posture, ultimately delivering both regulatory compliance and competitive advantage.
Common pitfalls include tracking too many metrics without clear priorities, focusing solely on technical indicators while ignoring business impact, using outdated data sources, and creating dashboards that lack actionable insights for decision-makers. These oversights often result in information overload and missed strategic opportunities, with many organizations finding that streamlined, business-aligned dashboards deliver more effective risk management and faster incident response capabilities.
Businesses can tailor cyber risk KPIs by aligning metrics with industry-specific regulatory frameworks, compliance requirements, threat landscapes, and operational priorities unique to their sector. Financial institutions focus on transaction security and data breach response times, while healthcare organizations emphasize patient data protection and system availability, ultimately delivering targeted risk management that addresses sector-specific vulnerabilities and regulatory expectations.
KPI dashboards enhance communication between IT and executive management by translating complex cyber risk data into executive-friendly visuals, providing real-time threat status updates, and establishing shared performance metrics that both teams understand. These dashboards enable strategic alignment through clear risk indicators, facilitate data-driven security investment decisions, and ultimately deliver improved organizational resilience with executives gaining actionable insights.
Artificial intelligence enhances cyber risk KPI dashboards by automating threat detection, predicting potential vulnerabilities, and providing real-time risk scoring across network environments. Through machine learning algorithms, organizations can identify anomalous patterns, prioritize security incidents, and forecast cyber threats more accurately, ultimately delivering faster incident response and more strategic cybersecurity resource allocation.
Leading indicators in cyber risk KPIs enable proactive threat prevention through metrics like security training completion rates, vulnerability patch times, and incident response drill frequencies, while lagging indicators measure actual outcomes like breach frequency and recovery costs. Organizations increasingly find that balancing both approaches delivers comprehensive risk visibility, with leading indicators helping prevent incidents and lagging indicators validating security program effectiveness, ultimately enhancing strategic cybersecurity decision-making.
Businesses can measure cyber risk management ROI through KPIs including incident response time reduction, cost per security breach, prevention savings, compliance efficiency rates, and security awareness training effectiveness. These metrics enable organizations to quantify risk mitigation value by comparing security investment costs against avoided breach expenses, reduced downtime, and enhanced operational resilience, with many enterprises finding that comprehensive KPI tracking demonstrates significant cost savings and competitive advantage.
Organizations can use benchmarks including incident response time metrics, vulnerability remediation rates, security awareness training completion percentages, compliance audit scores, and mean time to detection for threats. These benchmarks enable companies to measure performance against industry standards, identify gaps in their security posture, and demonstrate measurable improvements in risk mitigation, with many financial services and healthcare organizations finding that standardized metrics ultimately enhance their overall cybersecurity resilience.
-
Wonderful templates design to use in business meetings.
-
Great product with effective design. Helped a lot in our corporate presentations. Easy to edit and stunning visuals.
-
Top Quality presentations that are easily editable.
-
Amazing product with appealing content and design.
-
Unique and attractive product design.
-
Innovative and Colorful designs.
-
Unique research projects to present in meeting.
-
Really like the color and design of the presentation.
-
Appreciate the research and its presentable format.
-
Excellent design and quick turnaround.