


Warehousing kpi dashboard showing picking rates and daily replenishments




Try Before you Buy Download Free Sample Product
 Impress Your
 Audience
 100%
100% Editable
 Save Hours
 of Time


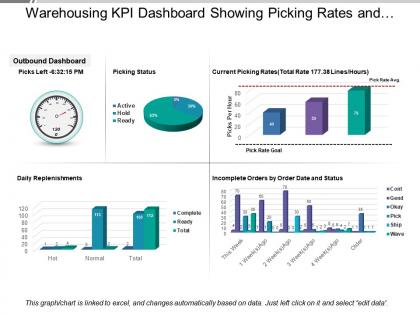
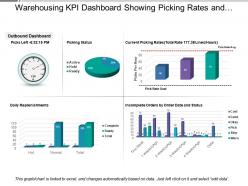
We are glad to offer our creative Warehousing KPI Dashboard Showing Picking Rates and Daily Replenishments PPT design template. Use this unique presentation diagram to showcase your pickup charges and daily replenishments in warehouse storage. The PPT design is perfectly fine to display pickups done and remaining, current pickup charges, incomplete orders and daily replenishments in the warehouses. The design slide is mainly used for inventory management slideshows to determine how much inventory has been used, inventory management, determining inventory cost in storage and made business plans accordingly. The design slide includes use of multiple excel linked color charts to represent different elements of presentation, where you just need to put your warehousing figures on excel sheet and charts in PPT will automatically get changed accordingly. Guidance for making changes has been provided by our professional experts. Design template is amazing, just download this awesome presentation template and make unique slideshows to show warehouse performance to your audience. Decipher the judgement with our Warehousing Kpi Dashboard Showing Picking Rates And Daily Replenishments. Explain the intent behind each clause.
People who downloaded this PowerPoint presentation also viewed the following :
Warehousing kpi dashboard showing picking rates and daily replenishments with all 6 slides:
Soar like a hawk with our Warehousing Kpi Dashboard Showing Picking Rates And Daily Replenishments. They will carry you to cloud nine.



FAQs for Warehousing kpi dashboard showing picking rates
Honestly, just focus on order accuracy first - anything below 99.5% and you're basically throwing money away on returns. Inventory turnover shows if you're actually moving product efficiently. Then track fulfillment cycle time from order to ship. Labor productivity matters too - picks per hour, cost per shipment, that stuff. Dock door utilization if you've got heavy traffic (though that one's kind of niche). Start there and you'll spot your biggest issues pretty quick. These five cover like 80% of what actually matters for warehouse performance.
Basically, inventory turnover shows you which products move fast vs slow. Put your hot sellers near packing stations - makes life way easier for your team. Slow movers can hang out in the warehouse equivalent of Siberia, honestly. You'll also figure out if you're hoarding too much dead inventory (guilty as charged, probably). The trick is creating zones based on this data. Fast stuff up front, slow stuff in back. Your pickers will thank you since they won't be doing CrossFit workouts just to grab popular items. It's pretty straightforward once you map it out.
Order accuracy is massive for warehouse metrics - it hits customer satisfaction and return costs hard. Track the percentage of orders shipped without errors (wrong items, quantities, damaged stuff). Most places shoot for 99%+, though anything under 98% means you've got real problems to sort out. Sample your outbound orders daily and break down errors by picker, zone, and type. Honestly, this is where you'll catch patterns and figure out who needs more training. Barcode scanning at every pick point is your first move if you don't have it already. Makes a huge difference.
Honestly, start by mapping out your current process - you'll spot the biggest bottlenecks pretty fast. Streamline your picking routes and move high-velocity items closer to packing stations. Basic layout changes can save way more time than you'd expect. Automation helps too if you've got the budget - conveyor systems, that kind of stuff. Cross-docking works great for fast-moving inventory. Track "Order Cycle Time" to measure from order received to shipped out. Some places also watch "Pick Time per Line Item" which gets more specific. I'd tackle the layout first though, it's usually the easiest win.
Dude, space utilization is massive for your bottom line. You're basically tracking how much warehouse space actually makes you money vs. sits there empty while you pay rent. Real estate costs are brutal these days! Most places should hit around 80-85% - go higher and you're screwed during busy seasons when you need room to move. Calculate what you're using now, then hunt for those dead spots you can flip into productive areas. Honestly, it's one of the easiest ways to put off expensive expansions and squeeze more profit from what you've got.
Look, tracking your warehouse productivity is huge - it shows you exactly where your money's disappearing. I'd focus on picks per hour and order fulfillment times first. Those turtle-speed areas you mentioned? The data will call them out fast. Labor's probably your biggest cost anyway, so knowing who needs training or where you're overstaffed saves serious cash. Honestly, most people overthink this stuff. Just pick 2-3 metrics, check them weekly, and you'll start seeing patterns. Then you can actually justify buying that equipment you've been eyeing instead of guessing.
Track order accuracy and picking speed first - those show real impact. Inventory turnover and cost per order are huge too. Labor efficiency gets tricky because automation changes headcount in weird ways sometimes. Error rates and cycle time matter especially with warehouse systems or robots. Honestly, get your baseline numbers before you do anything, then check again after 3-6 months. Don't go crazy with metrics though - stick to 3 or 4 max or you'll just confuse yourself with all the data.
Really depends on what kind of warehouse you're running. For retail, you'll want to watch inventory turnover, order accuracy, and how fast you're getting stuff out the door - customers are brutal about delivery times these days. Manufacturing is totally different though. They care more about having raw materials ready and keeping production lines fed without hiccups. Oh, and if you're in retail, seasonal trends can make or break your metrics. Honestly, just figure out what your actual customers care about most, then track backwards from there to see which numbers actually move the needle.
Honestly, the worst part is when different shifts track things completely differently - drives me crazy. Your systems probably don't sync up either, which makes everything messier. Start by getting everyone on the same page with data collection. Maybe focus on like 5 key metrics instead of tracking everything under the sun? I learned that one the hard way. Get a warehouse system that actually connects your data instead of having random spreadsheets everywhere. Also, train people on WHY these numbers matter, not just the mechanics. Set up dashboards so you're not stuck doing manual reports constantly - trust me on that one.
Yeah, safety incidents are honestly way more important than people think for warehouse metrics. You'll want to track incidents per 100k hours or per million cases - whatever makes sense for your operation. When incidents spike, everything else falls apart. Insurance goes up, workers comp claims pile up, and good luck keeping people around if they think they'll get hurt. I usually tell people to watch both the near-misses AND actual incidents. Near-misses are gold because they show you problems before someone actually gets injured. Review this stuff monthly with your other numbers - don't wait for quarterly reports or whatever.
So here's the deal - when transportation costs go crazy, you'll end up hoarding more inventory to avoid constant shipments. Your turnover ratios tank. Carrying costs shoot up. Order fulfillment gets expensive since shipping's baked right in. Honestly, it's such a pain because you're stuck between wanting fewer shipments but still keeping customers happy with stock availability. The whole thing creates this weird balancing act where your cost per stored order looks awful. You've got to nail that sweet spot between how much you hold versus how often you ship, or your KPIs will be all over the place.
Start with your forecast error percentage - that's your baseline. Then see how those errors mess with your actual warehouse stuff. Track inventory turnover, how often you're out of stock, and excess inventory sitting around. I also like watching "forecast-driven labor efficiency" because honestly, bad forecasts screw up your whole staffing game. The trick is connecting forecast accuracy to real costs and service levels. Once you nail down your current error rate, even bumping accuracy up 5-10% will show in your holding costs and fulfillment rates. It's pretty cool how those small improvements add up.
So customer satisfaction scores are basically how you figure out if clients are actually happy with your warehouse work - stuff like getting orders right, shipping fast, products arriving in good shape. I'd track it through surveys after delivery, maybe look at complaint rates or returns too. Honestly, this metric cuts through all the BS and shows if you're genuinely doing a good job. High scores usually mean customers stick around and renew contracts. Start simple - survey some customers monthly about their recent orders. Then dive into whatever complaints keep popping up.
Yeah, so doing audits more often will definitely bump up your accuracy numbers - you catch problems way faster and keep that cycle count above 95%. Your turnover data gets cleaner too. I watched one place switch from quarterly to monthly and their shrinkage dropped 30%, which was pretty impressive. Downside is obvious though - more labor costs and your team's gonna be slower during counts. But the accuracy improvements usually pay for that hit fairly quick. Oh, and start with your A-items first if you're gonna do this. That's where you'll actually see the difference in your overall numbers.
So definitely track energy use per square foot and your carbon footprint per shipment - those two alone will show you where you're actually at. Water usage per transaction is pretty eye-opening too, honestly more than I expected when I first looked into this stuff. The packaging waste-to-revenue ratio is smart because it connects your green efforts directly to profit margins. Also measure how much of your energy comes from renewables and your waste diversion rates. Oh, and don't skip employee engagement scores around sustainability - your team's buy-in makes or breaks everything. Just pick maybe 2-3 to start with though.
-
Unique research projects to present in meeting.
-
The content is very helpful from business point of view.