


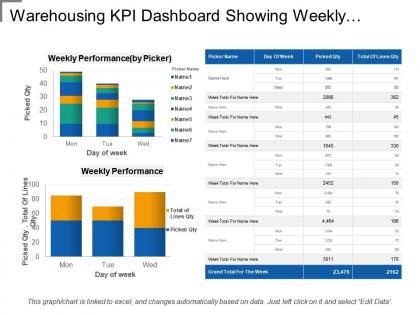
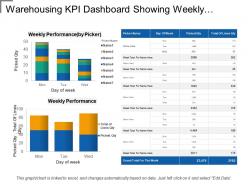
Warehousing kpi dashboard showing weekly performance by picker




Try Before you Buy Download Free Sample Product
 Impress Your
 Audience
 100%
100% Editable
 Save Hours
 of Time


Are you looking to display your organization’s warehouse weekly performance by picker? Use our Warehousing KPI Dashboard Showing Weekly Performance by Picker presentation template and display your warehousing weekly performance in most efficient manner. The design slide is perfectly fine to display the inventory already picked up, inventory remaining at storage place, warehousing weekly performance by picker. The design is highly useful now days as it’s always advantageous to know the inventory remained and required to do demand supply analysis and maintaining inventory according to your business needs, so that organizational goals can be achieved. The design slide contains few excel linked charts, KPI dashboard representing weekly performance in most efficient way. The usage of wonderful visuals and high-resolution icons make PPT look more impressive and your audience stick to presentation till the end of presentation. So, just download this attractive storage KPI dashboard showing weekly performance presentation design and show your warehouse performance in most unique way. Enjoy every bit with our Warehousing Kpi Dashboard Showing Weekly Performance By Picker. They will take you for a frolic.
People who downloaded this PowerPoint presentation also viewed the following :
Warehousing kpi dashboard showing weekly performance by picker with all 6 slides:
Be equated with the giants in your field with our Warehousing Kpi Dashboard Showing Weekly Performance By Picker. Enjoy being considered among the best.

FAQs for Warehousing kpi dashboard showing weekly
honestly start with just the big 3 - inventory accuracy, order fulfillment rate, and picking productivity. Those will tell you everything about whether your warehouse actually works or if it's a mess. After that, track warehouse capacity, receiving cycle time, and cost per shipment. Labor productivity is massive too - probably your biggest chance to save money. But seriously, don't create some crazy dashboard with 20 metrics that everyone ignores. I've watched companies do that and it's pointless. Pick these core ones first, make sure your team gets what affects each number, then maybe add more later if you need to.
Honestly, real-time data is a game changer for warehouse dashboards. Instead of looking backwards, you can actually fix problems as they pop up. Like, why wait three hours to hear about a bottleneck when you could've handled it immediately? Set up alerts for your critical numbers so your team jumps on issues right away. I'd focus on the stuff that changes fast first - picking accuracy and order cycle times usually give you the most impact. You'll catch inventory problems before they turn into stockouts and make quick adjustments. Way better than playing catch-up all the time.
Honestly depends what you're already working with. Manhattan or Blue Yonder? Check if they have dashboards built in first - saves you a headache. Power BI's pretty solid, though I personally think Tableau's interface is cleaner (might just be me). Excel works too if you're not getting fancy, but man does it get messy quick with pivot tables everywhere. Oh, and figure out your data sources first - like are you pulling from multiple systems? That'll basically decide which tool makes sense. Most warehouse guys I talk to end up with either Power BI or Tableau anyway.
Look at your actual pain points first - that's where you'll find the KPIs that matter. Cold storage? Track temp compliance and energy costs. E-commerce warehouse? Same-day shipping rates are probably huge for you. B2B operations care way more about pallet accuracy than some fancy metric that sounds cool. Honestly, half the dashboards I see are just copied from someone else's setup. Start small with maybe 3-5 metrics that actually hit your bottom line and keep customers happy. You can always add more later once you've got those dialed in.
Honestly, inventory accuracy is where you gotta start - everything else is pretty much garbage if this isn't solid. Your order fulfillment rates? Meaningless when the system thinks there's 100 units but only 75 are actually there. Can't optimize pick routes or figure out staffing either. Most good warehouses shoot for 95%+ and do daily cycle counts to track it. I'd focus here before getting distracted by the cooler-sounding metrics. It's kinda boring but all your other KPIs depend on this foundation being rock solid first.
Track your lead time from when orders come in until they ship out. I'd do a line chart for weekly averages - super easy to spot trends. But honestly? The histogram is where the magic happens. Shows you exactly where stuff gets stuck that you probably didn't even know about. Color-code everything green/yellow/red based on your targets so problems smack you in the face right away. Break it down by product type too since those have different timelines. Oh, and update it daily - trust me, catching issues early beats angry customer calls later.
Productivity metrics are honestly a game-changer for warehouse ops. You'll want to track stuff like picks per hour and order accuracy - that's where you see what's actually working. The crazy thing is how much difference there can be between your day and night crews. Once you have the data, you can figure out staffing issues and spot who needs more training. Don't overthink it though - just pick 2-3 metrics that actually matter for your setup and start there. You'd be surprised how fast you'll catch bottlenecks you didn't even know existed.
Oh man, KPI dashboards are honestly a game changer for this stuff. You get to see everything in one spot - pick rates, pack times, shipping mess-ups, inventory counts. No more jumping between like five different systems (which is the worst). When something's backing up, you'll catch it way earlier. Plus you can figure out if it's a people thing or a process thing that's slowing you down. Track your delivery times and order accuracy too. Start simple though - pick maybe 3 or 4 metrics that actually matter for speed and getting orders right. Don't go overboard at first.
Keep it simple - like 5-7 metrics max that your team actually uses to make decisions. Skip the vanity stuff that looks cool but doesn't matter for business. Your data needs to be accurate and update fast enough to be useful (stale inventory counts are useless). I've seen too many dashboards that look like a rainbow threw up - clean and simple beats fancy every time. Oh, and this is crucial: actually talk to your warehouse people about what they need. They're the ones using it daily, so their input matters way more than whatever looks good in theory.
Honestly, visualizing your warehouse KPIs is a game changer - way better than staring at endless spreadsheet rows. You'll actually spot weird patterns, like pick accuracy tanking every Tuesday (what's up with that?). Heat maps are perfect for finding bottlenecks in different zones. Real-time dashboards keep everyone on the same page too. Pick the right chart type though - gauges work great for hitting targets, line charts show trends, bar charts compare stuff. Oh, and don't go crazy at first. Start with maybe 3-4 key metrics and build from there.
Look, safety metrics matter way more than people think. Track your incident rates, near-misses, accident-free days, training completions - the usual stuff. But here's the thing: one injured worker can totally wreck your operations. Insurance claims, fines, shutdowns - it spirals fast. I've seen warehouses get slammed by regulators over stuff they thought was minor. Put these numbers right on your main dashboard so you catch problems early. Days without accidents is honestly my favorite metric because it's so straightforward. Bottom line: spot the trends before they become disasters that cost you serious money.
Check your daily stuff like pick rates and order accuracy every day, obviously. But don't go crazy - I made that mistake checking inventory turnover daily when monthly was plenty. Weekly or monthly deep dives work better for most metrics. Your dashboard updates itself, but you'll want to review the actual KPI definitions quarterly. Business changes, seasonal stuff happens, and honestly what mattered six months ago might be pointless now. Set a calendar reminder to look at your whole KPI setup every quarter and ask if they're still pushing the right behaviors. Trust me on this one.
Honestly, customer satisfaction metrics are like your reality check for warehouse ops. Sure, you might nail pick accuracy and crush throughput numbers, but if people are getting busted packages or the wrong stuff? You're still screwing up where it counts. Track order accuracy, delivery times, and damage rates next to your usual metrics. Sometimes what looks like a win internally doesn't actually make customers happy - learned that one the hard way at my last job. It's all about connecting warehouse floor performance to what people actually receive at their door.
Dude, these IoT sensors basically make your warehouse spit out data 24/7 straight to your dashboard. No more manual tracking of inventory, equipment stats, temperature changes - all that tedious stuff gets automated. Pick rates, storage space, cycle times? The sensors grab it all without you lifting a finger. Honestly, the visibility is insane once you see it working. You'll catch problems way before they blow up, which is clutch for making quick decisions. I'd say start small though - maybe just inventory tracking first. That way you can actually see if it's worth the hassle before going all-in.
Look, you're paying for that warehouse space no matter what, so empty spots are just money down the drain. Higher utilization spreads your fixed costs - rent, utilities, all that stuff - across way more inventory. Your cost per unit drops big time. Track cube utilization with inventory turnover on the same dashboard (trust me on this). If utilization goes up but turnover tanks? That's trouble brewing. Probably means you've got bottlenecks somewhere. The CFO won't be thrilled explaining wasted square footage to the board either.
-
Attractive design and informative presentation.
-
Informative presentations that are easily editable.