


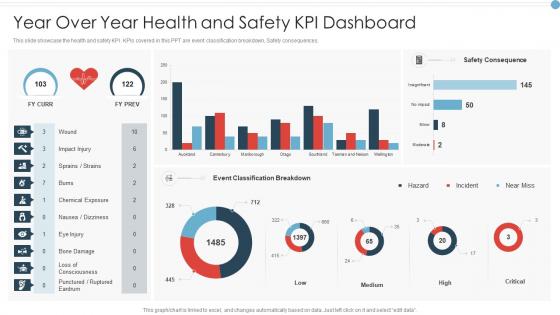
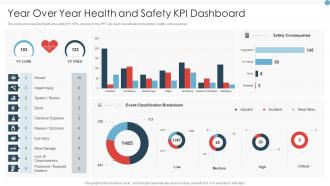
Year over year health and safety kpi dashboard




Try Before you Buy Download Free Sample Product
 Impress Your
 Audience
 100%
100% Editable
 Save Hours
 of Time


Our Year Over Year Health And Safety KPI Dashboard are topically designed to provide an attractive backdrop to any subject. Use them to look like a presentation pro.
People who downloaded this PowerPoint presentation also viewed the following :
Year over year health and safety kpi dashboard with all 7 slides:
Use our Year Over Year Health And Safety KPI Dashboard to effectively help you save your valuable time. They are readymade to fit into any presentation structure.





FAQs for Year over year health and
TRIR and LTIR are your bread and butter - they'll show you the real safety picture vs what management thinks is happening. DART rate matters too since it tracks actual time lost from injuries. But here's the thing most people miss: don't just focus on lagging indicators. Near-miss reporting frequency is huge, plus leading stuff like training completion rates and hazard ID reports. Those actually help you stop problems before they happen instead of just counting bodies afterward. Oh and safety audit scores - forgot that one. Start with TRIR though, it's the easiest baseline.
Honestly, figure out what your bosses actually lose sleep over first. Bottom line people? Hit them with workers' comp costs and lost-time injuries. If they're more culture-focused (rare but it happens), go with near-miss reporting or training completion rates. Don't overwhelm them - stick to 3-5 solid KPIs that tie directly to goals they're already tracking. The whole point is making your safety story connect with what keeps executives up at night. I've seen too many safety teams present metrics that sound impressive but don't move the needle on anything leadership cares about.
Dude, engaged workers are so much more likely to actually follow safety rules and call out sketchy situations. When people give a damn about their job, they won't just ignore unsafe stuff - they'll speak up. Makes total sense, right? They also show up for safety training instead of zoning out. The numbers are pretty wild too - companies with better engagement see like 40-50% fewer incidents. I swear this stuff is all connected. Your safety KPIs will probably tank if people feel disconnected from work. Focus on getting your team engaged first, then watch those safety metrics improve.
Get a solid tracking system going that hits incident frequency, severity, and what actually caused them across all your spots. TRIR and LTIR are the main metrics everyone uses - yeah, more acronyms to remember but whatever. Track per 200,000 work hours so you can compare sites fairly. Here's the thing though: don't just collect numbers and call it a day. Actually dig into the trends monthly. What department keeps having issues? Specific equipment acting up? Set up dashboards if you can swing it, and definitely check how you stack up against industry averages. Otherwise you're just guessing if you're doing okay.
Check out OSHA and your industry trade groups first - they've got the best data. Just make sure you're not comparing yourself to totally different companies, you know? Like don't use general manufacturing stats if you're doing specialized chemical work. That's honestly where most people mess up. I'd focus on maybe 3-4 key things like TRIR and DART rates instead of going crazy with every possible metric. Company size matters too when you're picking benchmarks. Pull your last quarter's numbers and see how you stack up against similar operations.
Honestly, ditch the manual reporting - it's such a pain. Smart helmets can track impacts automatically, and air quality monitors just do their thing in the background. Workers love those apps where they can report near-misses instantly too. Way better than dealing with spreadsheets all day! Start small though - pick like one or two solutions for your biggest headaches first. Once people get used to it, you can add more sensors and wearables. The dashboards will show you patterns you'd never spot otherwise. Some systems even use AI to predict problems before they happen, which is pretty cool.
Start with the basics - TRIR, DART rates, near-miss reports, and training completion percentages. Days since last injury is solid too. But honestly? Safety audit scores and how fast you close corrective actions are way more predictive than looking backwards at incidents. Real-time updates are crucial - weekly at minimum because old safety data won't help anyone. Set alerts for when things hit your warning thresholds. That way you're actually catching problems instead of just watching numbers after the fact. Oh, and make sure whatever system you use actually talks to people when something's off.
So here's the thing - training participation rates basically predict how your safety numbers will look. More people show up? You'll see fewer incidents and better hazard spotting. It's honestly pretty straightforward. People who actually engage with the training catch problems before they blow up into real issues. Your TRIR drops, near-misses get reported more, response times improve. The whole nine yards. Track both the participation rates and how people do on assessments afterward - that combo tells you if your safety culture is actually getting better or just looks good on paper.
Dude, safety culture makes such a huge difference with your KPIs. Incident rates drop. Near-miss reporting goes up because people aren't scared to speak up anymore. What's crazy is how engagement jumps too - workers feel safe calling out hazards without getting blamed for it. Your data gets way more reliable that way. Training completion rates and hazard spotting usually improve first, then the bigger metrics follow. Honestly, I'd focus on trust building before anything else. Once people genuinely care about safety instead of just checking boxes, the numbers take care of themselves.
Honestly, start with the obvious stuff - completion rates and test scores. Basic but you need those baselines. Then track incidents before/after training, plus near-miss reports (counterintuitively, MORE reports usually means people actually care about safety). Time-to-competency for new people matters too. I'd definitely grab employee feedback on training quality - they'll tell you if it sucks. The magic happens when you compare these metrics to actual safety outcomes over like 3-6 months. Monthly dashboard works great for catching trends early. Nothing fancy needed, just consistent tracking.
Honestly, good safety metrics are like a money printer for your business. Fewer accident claims mean lower insurance costs and way less downtime. Workers actually perform better when they're not constantly looking over their shoulder - makes total sense when you think about it. The real savings come from dodging those nightmare lawsuits and regulatory penalties that can tank your budget overnight. Recruiting gets easier too since top talent gravitates toward companies with solid safety records. First step? Figure out what accidents are currently costing you - the numbers might shock you.
Track both leading and lagging indicators - seriously, don't just count incidents after the fact. Near-miss rates and safety observations are gold. I've watched too many teams celebrate their "zero incident streaks" while completely missing the red flags right in front of them. Weight frequency by potential severity, not just what actually happened. Weekly reviews work way better than monthly ones - things move fast. Set up dashboards that catch trends early, and honestly? Make sure people actually get what the numbers mean for their day-to-day work. Otherwise you're just collecting data for nothing.
Honestly, audits are like your BS detector for safety metrics. Your incident reports might look amazing on paper, but you won't know if they're actually legit until someone physically walks around and checks. I've worked places where the numbers looked perfect until we did a real inspection - total mess. Monthly walk-throughs work great for catching stuff early. Do formal audits quarterly too. Otherwise you're just staring at spreadsheets that might not mean anything. It's the difference between what gets reported and what's really happening out there.
Don't wait around for the next quarterly meeting when those safety numbers start tanking. Dig into the data first - figure out if it's specific departments, certain incidents, or maybe particular shifts that are the problem. Get your safety team and managers involved right away to figure out what's actually going wrong. Here's the thing though - I've watched so many companies just dump more training on people without understanding the real issue. Talk to your employees honestly about what you're seeing. This stuff can spiral fast if you don't get ahead of it and fix the culture problems underneath.
Oh man, mental health tracking is huge right now - stress surveys, burnout indicators, that kind of stuff. Remote work totally flipped everything, so maybe look at digital fatigue or how many Zoom calls people are drowning in daily. Those old "X days without injury" signs feel so 2019 honestly. DEI safety metrics are worth considering too, plus cyber-wellness since we're all basically living on screens. Pick like 2-3 things that actually match your current headaches though - don't try measuring everything at once or you'll go crazy.
-
Great quality product.
-
It saves your time and decrease your efforts in half.
-
Good research work and creative work done on every template.