

 0 Comment
 Customer Reviews

Managing multiple business locations can be a challenging task—whether you’re in retail, banking, or distribution. Each branch operates with its own set of metrics, performance targets, and growth patterns. Without the right tools, keeping track of how every outlet is doing can quickly become overwhelming.
That’s where a branch dashboard comes to the rescue.
A well-designed branch performance tracker brings all your critical data: sales, revenue, customer interactions, and operational KPIs—into one centralized visual. It offers a performance overview at a glance, helping business leaders monitor trends, pinpoint underperforming areas, and identify growth opportunities across regions.
From tracking local performance metrics to comparing results across locations, a multi-branch dashboard simplifies complex data into clear, actionable insights. These means are especially useful for banks, retail chains, service centers, and franchises where location-based reporting plays a crucial role in strategic decisions.
In this blog, we’ll explore the Top Branch Dashboard Templates with Examples and Samples that will help you visualize performance like never before. Each of these templates—from sales by location reports to operational dashboards—is professionally designed to make your presentations efficient, engaging, and insight-driven.
Get your hands on our must have dashboard examples and templates to ensure smooth functioning and being organized as a team!
Whether you're a regional manager looking for a powerful business unit dashboard or a corporate executive overseeing hundreds of branches, these templates offer the ideal visual aid to streamline your strategy. With features like branch KPI monitors, site analytics, and area performance trackers, you’ll gain a deeper understanding of every unit's contribution to the big picture.
Explore our channel dashboard templates to offer a lens to view and understand the digital world you never had the chance to see!
Template 1: Corporate Dashboard PPT Template
Having a corporate dashboard can help you have an overview of the whereabouts of your company and keep tabs on the different operations. This slide deck will help you highlight the dashboards that illustrate revenues, operational expenses, technology bugs, project accuracy rate, corporate banking with growth rate, and operating expenses dashboard with gross profit. Along with it, you can showcase a KPI dashboard showing bounce rate, details about financial performance, and a summary dashboard with net promoter score.
[product_image id=932051]
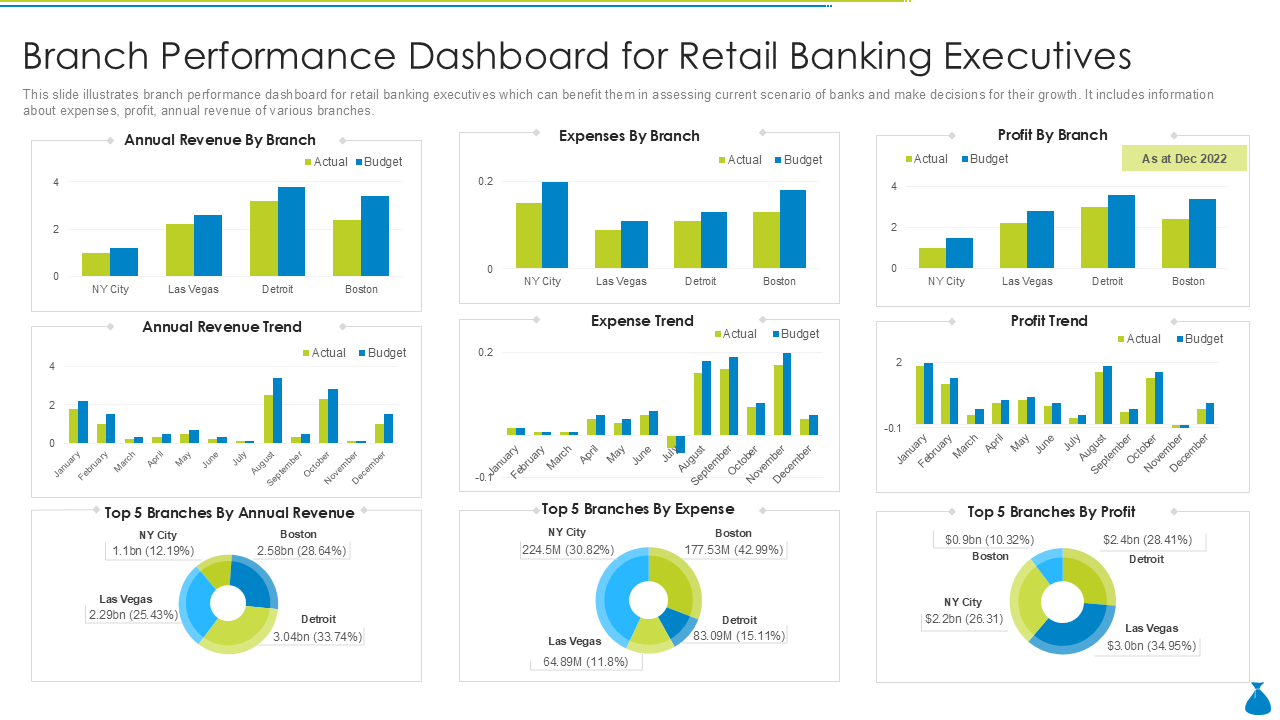
Template 2: Branch Performance Dashboard for Retail Banking Executives PPT Template
All the banks keep track of their performance and review it after a certain period of time. This pre-designed template helps in doing so by providing you with a ready-to-use brand performance dashboard. You get to highlight the annual revenue by branch, expenses, profit earned, annual revenue trend, top 5 branches by expenses, and top branches by revenue. You get to highlight all this through graphs for a better understanding and track of whether the performance has improved or declined in the past few months.
Template 3: Branch Performance Management Dashboard with Revenue and Product PPT Template
Managing brand performance is based on several key factors rather than one, and these indicators help you underline the key essentials that manage the product as well as the product. Through this template, you get to highlight the total revenue, number of branches, total clients, number of accounts, number of closed accounts and active accounts, top five revenue by branch, bottom five revenue by branch, revenue by gender, top five revenue by product, and bottom five revenue by product.

Template 4: Dashboard to Track Retail Bank Branches Performance PPT Template
Retail branch performance determines how effectively a branch contributes to achieving the organization's financial and marketing objectives. This template will help you provide you with a dashboard to track the retail branch's performance. You get to highlight the revenue, expenses, profit, and top branches by annual revenue, expense, and profit.

Template 5: Customer Sales Dashboards with Branches for Distribution Company PPT Template
Customer sales determine whether a bank branch has made growth, progress, and more profit than before. This customer sales dashboard will help you highlight the sales of different banks with branches for the distribution company. Through this content-ready slide, you get to underline the branch sales, monthly sales trends, accounts receivable by top customers, sales by top customers, and product actual vs. budget sales through graphs, charts, and enticing visuals so you can compare them effectively with the previous sales made.

Template 6: Different Branch Locations Performance Assessment Dashboard PPT Template
A bank may have different branches, and assessing the performance of different locations is important to check overall growth. This content-ready template will provide you with a dashboard so you can easily evaluate the performance of different branches. Through this template, you get to highlight the room-free revenue, room gross margin, vacancy rate, ancillary revenue, key performance indicators, and location description. Through this slide, you get to represent different branches' performance through charts and graphs.

Template 7: Branch Performance Dashboard with Profit and Revenue PPT Template
Tracking the branch performance on the factors of profit and revenue is essential to know the overall growth. Through this slide, you get to highlight the revenue, expenses, profit, revenue trend, expense trend, profit trend, top 5 branches by revenue, top 5 branches by expenses, and top 5 branches by profit. Get your hands on the branch performance dashboard to keep an eye on revenue and profit.

Template 8: Quarterly Bank Branch Deposit Dashboard PPT Template
The bank branch deposit dashboard will help you highlight the growth rate over different quarters. You can also underline the quarterly bank branch deposit of a month, the growth rate of the quarter, and the growth rate of 1 month on the basis of country and region. In addition, you can highlight the report filters over the quarters through a graph so you can see the actual difference.

Template 9: Branch Scoreboard Dashboard PPT Template
A scoreboard will help you keep tabs on the total number of accounts and how many of them are active and inactive. This pre-designed template will help you highlight the accounts opened and closed, deposits of goals, accounts by type, expense to budget, non-interest income to budget, and referrals by product. Get your hands on this branch scoreboard dashboard to track the total number of accounts through graphs.

Template 10: Projected Growth Dashboard in Branch Banking Operations PPT Template
Every business, be it banks or be it or anyone, makes future projections so they can grow. Through this pre-designed template, you get to underline the average savings account balance, transactions active rate, digital transactions percentage, products per customer, and digital transactions through graphs and charts to form a better knowledge.

Through these pre-designed slide decks, you can keep an eye on overall performance of different branches. Whether you manage a single location or oversee a nationwide network of outlets, having access to accurate, real-time data helps you make informed decisions, align strategies, and improve overall productivity.
By using these pre-designed branch dashboard templates, you can streamline performance tracking and make more informed decisions. From monitoring financial KPIs to evaluating operational efficiency across locations, these dashboards give you a real-time overview of what's working and where actual improvements are needed.
Whether you're managing five branches or fifty, having the visual access to critical metrics enhances collaboration, promotes accountability, and supports long-term business growth. You must not rely on outdated reports or scattered spreadsheets—go for these smarter insights that empower your entire team. Start exploring these dashboards today and take the first step toward optimized multi-branch management and strategic success. Explore the templates featured above and start optimizing your branch operations today.
P.S. Explore banking dashboard templates to display complicated financial key performance indicators!
Frequently Asked Questions (FAQs)
1.What key performance indicators (KPIs) are tracked for each branch?
Key performance indicators typically include revenue, expenses, profit margins, customer acquisition, account activity, and sales performance. These KPIs give an overall picture of each branch's performance and alignment with corporate objectives.
2.How is branch-level revenue performance visualized?
The branch-level revenue performance is visualized through bar graphs and interactive charts are used to visualize branch-level revenue performance. Revenue is often broken down by product, location and time period in these dashboards which makes it simple for stakeholders to compare outcomes and highlight branches that are performing well or poorly across different regions.
3.What data points indicate branch productivity?
Key data points include number of transactions, active versus inactive accounts, average handling time, sales per employee, and many other things. These metrics help you measure how effectively a branch operates and how well it utilizes resources.