

 0 Comment
 Customer Reviews

At the end of the month, have you ever looked at your expenses and thought, “Where did all the money go?” You scrutinize your bank statement, tally bills, groceries, and realize it’s the small things that add up fast.
Now picture running a business without tracking these ‘small things’. That’s exactly what overhead costs are. The silent drainers of your profits.
Whether it’s office rent, software licenses, or utility bills, overheads are unavoidable. But just like you’d use a personal budget tracker to stay on top of expenses, businesses require an Overhead Dashboard to monitor and manage these costs.
This is where SlideTeam’s Top 10 Overhead Dashboard Templates with Samples and Examples step in.
These dashboards are curated for finance teams, business owners, and startups trying to make every penny count. With a well-structured overhead dashboard, these slides track KPIs at a glance. These 100% editable and customizable slides come with plug-and-play charts, customizable layouts, and overhead dashboard examples to fit in any industry.
Whether you wish to simply report overheads or track advanced overhead analytics, these slides transform the way you view your business expenses. You’ll no longer be reacting to high costs and see them coming in advance, and more importantly, do something about them.
Let’s explore!
Template 1: Business Overheads Management Process Dashboard
This PowerPoint Slide illustrates a complete corporate overheads management process dashboard designed to improve project tracking and resource allocation. The template has five essential elements to streamline the management of projects. It provides project phase monitoring, real-time completion status, cost estimate visualization, and budget analysis. It also helps to manage remaining tasks by connecting them with people’s responsibilities. It also presents job load allocation among team members and tracks approaching deadlines. This systematic structure enables managers to track work, manage budgets, and fulfill deadlines more efficiently. Grab it today!

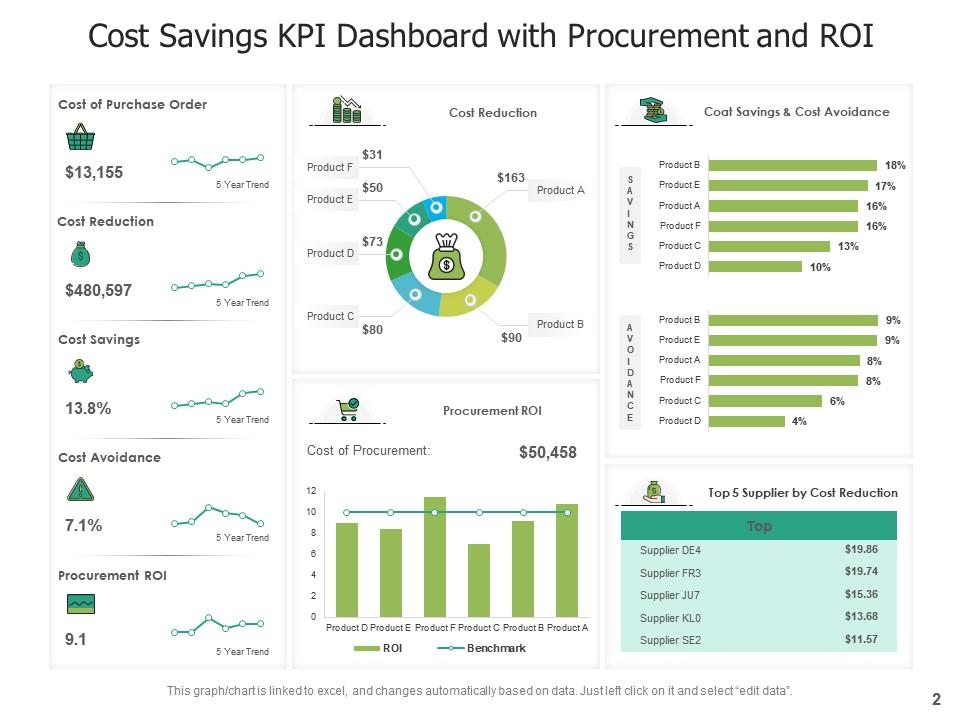
Template 2: Cost Savings KPI Dashboard with Procurement and ROI
This PowerPoint Template demonstrates a full cost savings KPI dashboard that monitors procurement performance and ROI indicators across categories. The template displays financial indicators, such as purchase order costs, cost reduction outcomes, savings percentages, and avoidance measures, along with trend analysis. It has an interactive donut graphic that displays savings in costs by product category. Bar charts provide procurement ROI benchmarking for improved financial insights. The layout includes cost savings breakdowns by product line and top supplier rankings based on cost reduction performance.
Template 3: Project Costs Dashboard with Allocated and Used Budget
Effective budget management improves project success rates by enabling real-time financial visibility and control. This PPT Slide presents a detailed project cost dashboard. It displays five important performance metrics at the top, including allotted budget, and used budget. It also displays expected and actual expenditures for detailed financial tracking. The design includes dual comparison bar charts to facilitate budget analysis. One graphic compares allotted against used budgets, while the other compares projected to actual expenses. These ideas apply to a range of project portfolios, including facility renovations, human capital efforts, the insurance industry, and operational excellence. Project managers, financial controllers, portfolio directors, and executive stakeholders can use this slide.

Template 4: Project Costs Dashboard with Employee Workload
Can companies manage project budgets while maximizing staff productivity and resource allocation? This PowerPoint Slide illustrates a project cost dashboard that incorporates staff workload management across dimensions. The slide supports project phase monitoring and real-time completion status. It also provides a visual analysis of the project budget with usage and displays individual employee effort allocation. This comprehensive design allows managers to connect financial performance with team capacity, detect difficulties, and improve resource allocation.

Template 5: Software Deployment ROI Dashboard with Cost Savings from Application Requests
Want to measure ROI from software requests with visual clarity? This PowerPoint Template has a clean, data-driven structure and includes indicators, such as software requests completed, cost savings, and help desk time saved. The dashboard contains a cost-saving line chart that is assigned across time and enables tracking of success. This template is ideal for IT managers and decision-makers since it allows them to easily describe the impact of deployments and streamline reporting.

Template 6: Software Asset Management Dashboard with Monthly Cost Savings KPI
This dashboard design makes managing software assets and saving costs much easier. Its modern overhead dashboard design highlights KPIs, such as prospective and actual savings, active reclamations by state, and a monthly savings tracker. The layout features vast visualizations such as bar graphs for top software reclaims and status-based classification, which provide immediate additional information.

Template 7: Customer Project Cost Dashboard with Manager Task Workload
Balancing customer profitability with management productivity demands advanced tracking systems that combine financial and operational variables. This PowerPoint Slide provides a detailed client project cost dashboard. It focuses on task sharing among project managers to improve resource planning. The dashboard displays customer projected income to help track financial performance. It also displays the completion status by owner, with color-coded progress indicators providing quick visual insights. Additionally, job completion percentages are presented to track progress. Download now!

Template 8: Organizational Project Cost Forecast with Summary
Strategic financial forecasting improves organizational decision-making by giving predicted information about project costs and performance trends. This PPT Slide illustrates an in-depth organizational project cost prediction, including current cost, anticipated cost, and percentage spent. The template illustrates cost prediction patterns with clear multi-line charts for easy comparison. It monitors the cost performance index over time to determine budget efficiency. This unified style helps managers to forecast financial results and enhance resource allocation techniques. Grab it today!

Template 9: Project Costs Dashboard with Yearly Billing
This PowerPoint Template demonstrates a complete project expenses dashboard that includes annual billing information across multiple performance criteria. The layout includes three essential performance indicators such as total projects, billing amount, and hours performed. These indicators give an overview of overall performance. It contains accurate visuals of project type and stage analysis to aid classification. This complete dashboard helps businesses successfully evaluate project profitability, resource use, and billing efficiency.

Template 10: Project Costs Saving and Avoidance Dashboard
This PPT Template displays a solid and well-organized layout. It focuses on important performance measures including purchase order cost, yearly cost reduction, and overall savings. The dashboard also monitors cost avoidance percentage and buying ROI, with a five-year trend analysis providing full insights. It offers visual aids such as bar and donut charts, project ROI benchmarking, and a breakdown of savings vs avoidance per product. Download today!

Stay Ahead with these Ready-to-Use Templates
Managing overhead is all about making smart choices. With these pre-designed Top 10 Overhead Dashboard Templates, you gain control over every hidden cost that could quietly shrink your profits. These templates are simplify overhead reporting, make data visualization easy, and give you actionable insights. Whether you're planning, budgeting, or reviewing past expenses, these dashboards help in tracking overhead like a professional.
PS: Are you also looking for pre-designed maintenance dashboards? Follow this link for our templates with samples and examples.
FAQs
1. Why is overhead tracking important for businesses?
Overhead tracking helps businesses know where their money is going. Overhead costs are things like rent, electricity, office supplies, and staff salaries that don’t directly make a product but are needed to run the business. Tracking these costs, a business can see if it is spending too much and find ways to save money. It also helps set the right prices for products or services.
2. What key metrics should be included in an overhead dashboard?
An overhead dashboard should include a few key metrics that help track costs and performance of a business. These include total overhead costs, cost per department, and fixed vs. variable expenses. It should also show employee productivity, budget vs. actual spending, and utility or supply costs. If the business has multiple locations, tracking overhead by location can also help.
3. How can overhead dashboards help in cost reduction?
Overhead dashboards help in cost reduction by showing your expenses in one place. They make it easy to see where money is being spent and where it can be saved. This way, managers can quickly take action to cut down extra costs. It also helps track how budgets are being used over time.