


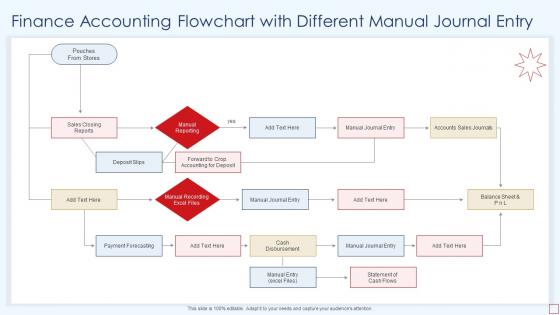
Finance Accounting Flowchart With Different Manual Journal Entry




Try Before you Buy Download Free Sample Product
 Impress Your
 Audience
 100%
100% Editable
 Save Hours
 of Time


Our Finance Accounting Flowchart With Different Manual Journal Entry are topically designed to provide an attractive backdrop to any subject. Use them to look like a presentation pro.
People who downloaded this PowerPoint presentation also viewed the following :
Finance Accounting Flowchart With Different Manual Journal Entry with all 6 slides:
Use our Finance Accounting Flowchart With Different Manual Journal Entry to effectively help you save your valuable time. They are readymade to fit into any presentation structure.





FAQs for Finance Accounting Flowchart With Different
Key components of a finance accounting flowchart include accounts payable and receivable processes, general ledger entries, financial reporting workflows, budget allocation procedures, and audit trail documentation. These elements work together by streamlining transaction recording, enhancing compliance monitoring, and automating reconciliation processes, with many financial institutions finding that comprehensive flowcharts ultimately deliver improved accuracy and operational efficiency.
A flowchart streamlines financial processes by visualizing workflow sequences, identifying bottlenecks, standardizing procedures, and eliminating redundant steps across departments. Through clear process mapping, organizations enhance accuracy in accounts payable, budgeting, and financial reporting while reducing processing times, minimizing errors, and ensuring regulatory compliance, ultimately delivering improved operational efficiency and stronger financial controls.
Common finance accounting flowchart symbols include rectangles for processes like journal entries and ledger postings, diamonds for decision points such as approval requirements, ovals for start/end points, and arrows indicating workflow direction. These standardized symbols streamline financial documentation by creating clear visual representations of accounting cycles, audit trails, and approval workflows, with many organizations finding that consistent symbolization enhances compliance transparency and operational efficiency.
Finance accounting flowcharts begin with the initial transaction or data entry point, such as invoice receipt, purchase orders, or journal entries, and conclude with final outputs like financial statements, reports, or regulatory filings. Effective flowcharts map the complete cycle from source documents through processing stages to end deliverables, with many organizations finding that clearly defined start and end points streamline audit trails and enhance operational transparency.
A finance accounting flowchart ensures regulatory compliance by mapping audit trails, documenting internal controls, standardizing reporting procedures, and tracking transaction authorization pathways. These visual frameworks enable organizations to demonstrate GAAP adherence, satisfy SOX requirements, and streamline regulatory audits, with many financial institutions finding that structured process documentation significantly reduces compliance risks and audit preparation time.
A flowchart improves collaboration by providing clear visual documentation of finance processes, standardizing communication protocols, and establishing defined touchpoints between departments. Through transparent workflow mapping, teams across operations, sales, and procurement can understand their roles in financial processes, reducing miscommunication while enabling faster approvals, streamlined reporting, and ultimately delivering enhanced cross-departmental efficiency.
Common pitfalls include overcomplicating processes, omitting key approval steps, failing to include exception handling, ignoring compliance requirements, and lacking clear decision points. These oversights often result in operational bottlenecks, audit failures, and regulatory issues, with many finance teams finding that simplified, comprehensive flowcharts enhance accuracy, streamline workflows, and ensure consistent financial reporting across departments.
Technology tools enhance finance accounting flowcharts through automated data integration, real-time visualization software, and AI-powered analytics that streamline complex financial processes. Cloud-based platforms like Microsoft Visio and Lucidchart enable collaborative flowchart creation, while advanced analytics tools help financial institutions identify bottlenecks, optimize workflows, and ensure regulatory compliance, ultimately delivering faster reporting cycles and improved operational efficiency.
A clear flowchart enhances financial decision-making by providing structured visualization of processes, standardizing approval workflows, and reducing decision-making time through transparent pathways. These visual tools enable finance teams to identify bottlenecks, streamline budget allocations, and minimize errors in critical processes like expense approvals and investment decisions, ultimately delivering faster strategic responses and improved operational efficiency.
A finance accounting flowchart assists in training new employees by providing visual step-by-step guidance through complex accounting processes, standardizing procedures across teams, and reducing learning curves significantly. Through clear process mapping, new hires can quickly understand transaction flows, approval hierarchies, and compliance requirements, while experienced staff spend less time on repetitive training, ultimately accelerating onboarding and ensuring consistency.
High-level finance accounting flowcharts provide broad overviews of major processes like revenue recognition, expense management, and financial reporting cycles, while detailed flowcharts break down specific steps, decision points, and documentation requirements within each process. Organizations typically use high-level charts for strategic planning and stakeholder communication, with detailed versions enabling operational teams to streamline workflows, ensure compliance, and ultimately deliver greater accuracy and efficiency.
Stakeholder feedback enhances finance accounting flowcharts by identifying process bottlenecks, clarifying role responsibilities, and revealing gaps in documentation or approval workflows. Through regular input from CFOs, auditors, and department heads, organizations streamline reporting cycles, minimize compliance risks, and improve data accuracy, ultimately delivering faster month-end closures and enhanced financial transparency.
Key metrics for evaluating finance accounting flowchart effectiveness include processing time, error rates, compliance adherence, resource utilization, and audit trail completeness. Through systematic measurement, organizations streamline monthly closes, reduce reconciliation discrepancies, and enhance regulatory reporting accuracy, with many financial departments finding that optimized flowcharts deliver faster period-end processes and improved operational transparency.
Finance accounting flowcharts should be reviewed quarterly and updated whenever significant changes occur in processes, regulations, or organizational structure. These regular assessments enable organizations to maintain compliance, enhance operational efficiency, and adapt to evolving financial requirements, with many companies finding that proactive updates streamline audits and minimize regulatory risks.
When presenting finance accounting flowcharts to stakeholders, focus on clear visual hierarchy, simplified terminology, and logical process flow that aligns with business objectives and regulatory requirements. These presentations should emphasize key decision points, control mechanisms, and risk mitigation steps, with many organizations finding that interactive walkthroughs and sector-specific examples enhance stakeholder understanding and buy-in.
-
I have been using SlideTeam for the past six months. Very happy and satisfied!
-
Awesome use of colors and designs in product templates.