


Project Status Summary Dashboard With Time And Resource Allocation





Try Before you Buy Download Free Sample Product
 Impress Your
Audience
 100%
Editable
 Save Hours
of Time


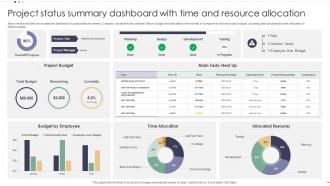
Below mentioned slide showcases the dashboard of project status summary. Company can identify the potential risks in budget and task status with the help of components that are project budget, upcoming task progress and time allocation to different tasks.
People who downloaded this PowerPoint presentation also viewed the following :
Project Status Summary Dashboard With Time And Resource Allocation with all 7 slides:
Use our Project Status Summary Dashboard With Time And Resource Allocation to effectively help you save your valuable time. They are readymade to fit into any presentation structure.






FAQs for Project Status Summary Dashboard With Time
So I'd definitely throw in project timelines with milestones, budget tracking, and task completion percentages. Team workload distribution is huge too - plus risk indicators and upcoming deadlines (seriously, that deadlines section has saved me so many times). Scope changes and blockers are must-haves. Oh, and add a quick executive summary for the higher-ups who just want the cliff notes. Keep everything visual instead of drowning people in text. Start with those basics, then build out based on whatever your team keeps bugging you about.
Honestly, these things are lifesavers. You know how you're always hunting through Slack threads trying to figure out who's supposed to be doing what? A good dashboard just puts everything right there - current tasks, what's stuck, who owns what. No more of those awkward meeting moments where everyone's staring at each other like "I thought YOU were handling that." Real-time updates beat waiting for those weekly emails that are already old news anyway. Just make sure you use color coding and clear labels, otherwise people will still be confused. Worth the setup time for sure.
Start with timeline progress (% complete vs planned) and budget burn rate - those are your bread and butter. Task completion velocity is solid too. Honestly, milestone tracking with those visual timeline bars against target dates? Stakeholders eat that stuff up every time. Resource utilization matters if you're juggling team capacity. But here's the thing - don't go overboard with metrics or people just tune out completely. I learned that one the hard way! Stick to these core ones first, then only add more if your team actually requests them.
Honestly, visual design can make or break your dashboard. People will straight up ignore it if it looks terrible - I've watched perfectly good data get buried under ugly interfaces. Your team should spot critical info within seconds of opening it. Use color coding that actually makes sense (not just random reds and greens). Clean typography helps a ton, plus consistent spacing so it doesn't look like a mess. Oh, and hierarchy matters - guide their eyes to what's urgent first. Sounds obvious but you'd be surprised how many dashboards fail at this basic stuff.
Tableau and Power BI are your best bets if you want something really solid - both have amazing visualizations. Monday.com and Asana are way more user-friendly though, with decent dashboard features built right in. Grafana's incredible but honestly? It's a pain to set up unless your team's pretty technical. I'm still figuring mine out from last month. Google Data Studio works fine for basic stuff and won't cost you anything. Really depends on where your data lives and how tech-savvy everyone is. Just grab some free trials first - you'll know pretty quickly what feels right for your team's workflow.
Don't cram everything onto one screen - trust me on this one. Pick like 5-7 metrics that actually matter instead of showing off every data point you've got. Skip the red/green thing since colorblind people exist (learned that the hard way). Those fancy animations? They just make everything slower and honestly kind of annoying. Your refresh rate should be useful but not constantly updating every 2 seconds. Oh, and definitely test it with real users first. What seems super obvious to you will probably confuse the hell out of everyone else.
Different people need totally different dashboards, trust me on this one. Execs just want the big picture - budget health, timelines, major risks, that red/yellow/green status stuff. Meanwhile your team members are drowning in details like task assignments, blockers, sprint updates. I always set up separate tabs or role-based filters because otherwise you'll get bombarded with irrelevant questions all day. Ask each group what numbers they actually use to make decisions. Then build those specific views. Honestly, it's saved me so much headache - way better than one messy dashboard that confuses everyone.
You're basically flying blind without real-time data on your dashboard. Seriously, it's like trying to drive with last week's traffic report. When stuff goes sideways - budget issues, delays, whatever - you'll catch it immediately instead of finding out way too late. Quick decisions become actually possible when your team isn't working off stale info. Honestly, manual updates are a nightmare, so automate those data feeds if you can. Your stakeholders will thank you for not giving them ancient news. It's the difference between staying ahead of problems versus constantly playing catch-up.
Set up alerts for stuff like budget burn rate, timeline slips, or when your team's velocity tanks. Visual dashboards are honestly so much better than staring at spreadsheets trying to spot problems. Watch for trends - like three straight weeks of declining velocity or scope that keeps creeping up. Don't just look at snapshots. Hit those yellow and red thresholds before you're scrambling to fix everything. Weekly check-ins on your risk indicators will save your butt. Create action plans when you see the warning signs, not after everything's already gone sideways.
Automate your data feeds first - that's where most accuracy issues start. Weekly check-ins with project leads work well, though bi-weekly might be enough depending on how fast things move. Make sure everyone knows what your status colors actually mean (seriously, "yellow" means different things to different people). Give one person ownership of each section so you don't get that awkward "wait, who was supposed to update this?" moment. Oh, and build in some validation checks. Spot-audit everything monthly because people will mess things up without meaning to. Start with your three most critical metrics and get those rock-solid first. Don't try to perfect everything at once.
Honestly, dashboards are a game-changer for agile teams. Real-time visibility into sprints means you can actually see what's happening instead of guessing. Track your velocity and burndown charts without digging through Jira every five minutes. Daily standups become way less painful when everyone can see the blockers and progress upfront. Stakeholders stop bugging you for updates too, which is nice. You'll spot bottlenecks before they become disasters. Set it to auto-refresh from whatever tool you're using - saves me like an hour of manual updates each week. Trust me on this one.
Quick surveys work great, plus just talking to your key people one-on-one. Usage data shows what features people actually ignore (which is honestly pretty eye-opening). Put a feedback widget right in the dashboard - people complain way more when it's easy. Watch for patterns in what confuses users or what data they're asking for. Don't just listen to whoever yells loudest though. Start small with clearer labels and better filters, then hit the bigger changes based on what keeps coming up.
Honestly, go digital for project updates - it's way easier than dealing with printed stuff. Real-time dashboards are clutch here. Tableau and Power BI are solid options, though even SharePoint can work if you set it up right. Make sure whatever you pick works on phones because people always end up checking these things during random meetings (guilty as charged lol). I'd start with one main dashboard that refreshes automatically. Then you can always pull static versions for emails if your stakeholders want that traditional format. Skip the printed reports unless someone specifically asks - they're kind of a pain to maintain anyway.
Your dashboard needs constant tweaking based on what people actually want to see. Start with scope and resources early on, then shift to milestones and risks as things progress. Monthly check-ins with stakeholders work well - just ask what numbers matter most right now. Here's the thing though: watch what they skip during meetings. If everyone glazes over during certain sections, those metrics aren't doing their job anymore. I've watched so many pretty dashboards turn into useless wall art because nobody updated them. Keep adjusting it or it'll just collect digital dust.
Get your team involved from day one - ask what they actually want to track and how they like seeing data. Nobody's gonna use something that takes forever to update, so keep it simple. I'd focus on showing quick wins first, like how it caught a problem early or whatever. Don't just send people a link and hope for the best - actually walk them through it. Use it yourself in meetings so they know you're serious about it. Honestly, half the battle is just being patient with people who hate change. Oh, and make sure it solves real problems, not just something the bosses think looks good.
-
Easily Editable.
-
Eye-catching PPT designs, outstanding team, and best customer service. I’m a super satisfied customer here!