3 Year Income Statement Of Organization Financial Planning And Analysis Best Practices
Try Before you Buy Download Free Sample Product
Audience
Editable
of Time
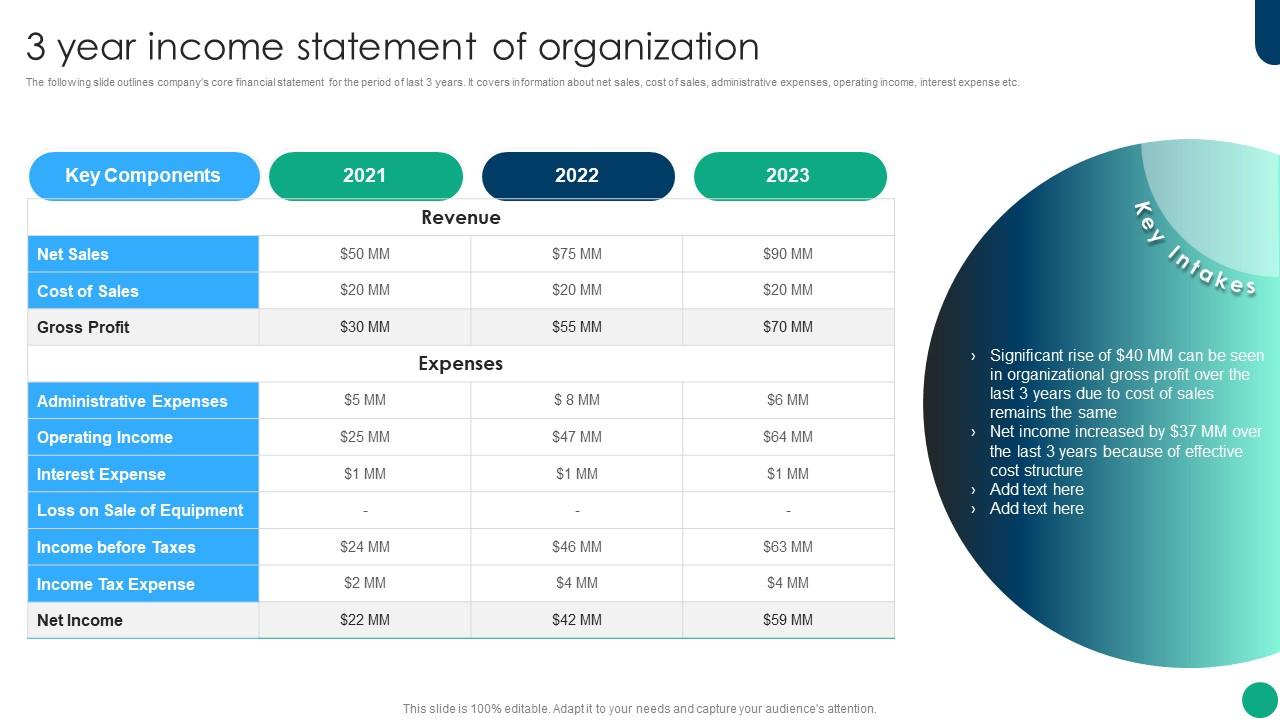
The following slide outlines companys core financial statement for the period of last 3 years. It covers information about net sales, cost of sales, administrative expenses, operating income, interest expense etc.
People who downloaded this PowerPoint presentation also viewed the following :
3 Year Income Statement Of Organization Financial Planning And Analysis Best Practices with all 6 slides:
Use our 3 Year Income Statement Of Organization Financial Planning And Analysis Best Practices to effectively help you save your valuable time. They are readymade to fit into any presentation structure.
FAQs for 3 Year Income Statement Of Organization Financial Planning And
Key income statement components include revenue, cost of goods sold, gross profit, operating expenses, operating income, interest expenses, taxes, and net income. These elements enable businesses to track profitability across manufacturing, retail, and service sectors, while providing stakeholders with comprehensive financial transparency, ultimately delivering strategic insights for resource allocation and competitive positioning.
Businesses ensure accurate revenue recognition by implementing robust accounting systems, conducting regular compliance audits, training finance teams on current standards, and establishing clear documentation processes for all transactions. Through automated revenue tracking and systematic review procedures, organizations streamline financial reporting while maintaining transparency, ultimately delivering reliable statements that support strategic decision-making and investor confidence.
Common income statement pitfalls include inconsistent revenue recognition, misclassifying expenses between operating and non-operating categories, overlooking accrued liabilities, and failing to properly match revenues with corresponding expenses. These accounting missteps can mislead stakeholders about financial performance, with many organizations finding that implementing standardized review processes and regular reconciliations ultimately delivers greater transparency and more reliable financial reporting.
Businesses can effectively illustrate seasonal fluctuations through quarterly comparisons, year-over-year analysis, rolling averages, and supplementary charts that highlight peak and trough periods. These presentation methods enable stakeholders to distinguish between cyclical patterns and underlying business performance, with many retail and hospitality organizations finding that clear seasonal documentation enhances investor confidence and strategic planning.
The income statement serves as the foundation for financial forecasting and budget planning by providing historical revenue patterns, expense trends, and profitability metrics that inform future projections. Organizations use these insights to set realistic revenue targets, allocate resources strategically, and identify growth opportunities, with many financial teams finding that detailed income analysis enables more accurate forecasting and competitive advantage.
Comparatives in income statements enhance financial performance analysis by enabling trend identification, variance analysis, and performance benchmarking across multiple periods. These side-by-side comparisons allow analysts, investors, and management teams to quickly spot revenue growth patterns, expense fluctuations, and profitability trends, ultimately delivering deeper insights for strategic decision-making and financial forecasting.
Distinguishing between operating and non-operating income enables stakeholders to evaluate a company's core business performance versus one-time gains or investment activities, providing clearer insights into sustainable profitability and operational efficiency. This separation helps investors, lenders, and management assess the consistency and predictability of earnings from primary business operations, while identifying revenue from asset sales, interest, or other ancillary sources that may not recur regularly.
Visuals and graphs transform income statement data by making complex financial trends immediately comprehensible, highlighting key performance indicators through charts, and enabling quick identification of revenue patterns, expense anomalies, and profitability shifts. These visual elements streamline executive decision-making by presenting comparative data across periods, with many financial teams finding that stakeholder engagement significantly improves when numerical data becomes accessible visual storytelling.
Different accounting methods significantly impact revenue recognition timing, expense matching, and overall financial presentation, affecting profitability metrics, tax obligations, and investor perceptions. These variations influence cash flow patterns, regulatory compliance requirements, and strategic decision-making, with many organizations finding that method selection ultimately determines competitive positioning and stakeholder confidence in financial transparency.
Businesses should update income statements monthly for internal management and quarterly for stakeholder reporting, with comprehensive annual reviews for strategic planning. This regular cadence enables organizations to identify trends early, adjust operational strategies promptly, and maintain accurate financial forecasting, with many companies finding that monthly reviews significantly enhance budget control and competitive responsiveness.
A poorly presented income statement can significantly undermine stakeholder confidence by creating confusion about financial performance, raising questions about management competency, and suggesting inadequate internal controls or transparency issues. This presentation problem often leads investors, lenders, and partners to perceive higher risk levels, ultimately resulting in reduced investment interest, higher borrowing costs, and diminished market credibility for the organization.
Best practices for disclosing extraordinary items include separating them from ordinary operations, providing detailed explanations in footnotes, clearly labeling their nature and financial impact, ensuring compliance with accounting standards, and presenting them net of tax effects. These practices enhance financial transparency by helping investors distinguish between recurring operational performance and one-time events, ultimately delivering clearer insights into a company's sustainable earnings potential.
An income statement complements other financial statements by providing profitability context that connects to balance sheet equity changes and cash flow operational activities. Together, these statements deliver comprehensive financial transparency, with net income flowing to retained earnings on the balance sheet, while cash flow statements reveal how profitability translates into actual liquidity and operational efficiency.
**INPUT**: What tools or software are best for creating accurate and visually appealing income statements? **OUTPUT**: Leading income statement tools include QuickBooks, Excel, Xero, FreshBooks, and specialized presentation software like PowerPoint or Google Slides for visual enhancement. These platforms streamline financial reporting by automating calculations, ensuring compliance standards, and enabling customizable formatting, with many accounting professionals finding that strategic combinations of accounting software and presentation tools ultimately deliver both accuracy and compelling visual communication for stakeholders. [Word count: 60 words]
An effective narrative transforms raw income statement data into strategic insights by contextualizing revenue trends, explaining expense variations, highlighting operational improvements, and connecting financial metrics to business strategy. This storytelling approach helps investors, lenders, and board members understand performance drivers rather than just numbers, with many stakeholders finding that comprehensive narratives build greater confidence, facilitate informed decision-making, and ultimately strengthen relationships through transparent communication that demonstrates management's strategic vision and accountability.
-
It saves your time and decrease your efforts in half.
-
One word for SlideTeam–Versatile!