Brand Portfolio Management Mapping Future Profits Through Need State Analysis Branding SS
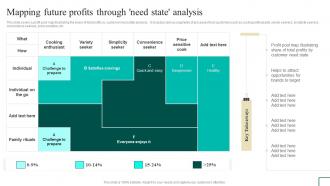
This slide covers a profit pool map illustrating the share of total profits by customer need state analysis. . It includes various segments of processed food customers such as cooking enthusiasts, variety seekers, simplicity seekers, convenience seekers, price sensitive, etc.
You must be logged in to download this presentation.
 Impress your
 audience
Editable
of Time
PowerPoint presentation slides
This slide covers a profit pool map illustrating the share of total profits by customer need state analysis. . It includes various segments of processed food customers such as cooking enthusiasts, variety seekers, simplicity seekers, convenience seekers, price sensitive, etc. Deliver an outstanding presentation on the topic using this Brand Portfolio Management Mapping Future Profits Through Need State Analysis Branding SS. Dispense information and present a thorough explanation of Convenience Seeker, Cooking Enthusiast, Mapping Future Profits using the slides given. This template can be altered and personalized to fit your needs. It is also available for immediate download. So grab it now.
People who downloaded this PowerPoint presentation also viewed the following :
Brand Portfolio Management Mapping Future Profits Through Need State Analysis Branding SS with all 6 slides:
Use our Brand Portfolio Management Mapping Future Profits Through Need State Analysis Branding SS to effectively help you save your valuable time. They are readymade to fit into any presentation structure.
-
“I really like the convenient operation and professionalism I saw on the SlideTeam website. I want to express my regards and appreciation to the team.”
-
It’s really cool, and you can find pretty much everything you could need for your work or school.


