

Business process optimization customer onboarding process powerpoint presentation slides




Try Before you Buy Download Free Sample Product
 Impress Your
 Audience
 100%
100% Editable
 Save Hours
 of Time


Introducing our business process optimization customer onboarding process PowerPoint presentation slides. Retain your customers with help of our business procedure optimization PowerPoint deck. Open up about the challenges and the remedial measures using our client onboarding PPT layout. Using this consumer orientation PowerPoint design helps in identifying the actions needed to increase customer interest. Incorporate this ready to use customer processing PPT theme to accurately measure the key onboarding metrics. Assimilating this business procedure PowerPoint set helps you in discovering new channels for advertising your product and generating new leads. Use this commerce boosting PPT template to deal with major challenges of customer engagement. Keep check on all your diligent efforts for sales marketing by incorporating this user processing PPT bundle. This customer incorporation PPT deck lets you create required variations to icons and colors, making this PPT more practical. Choose this user boosting process PowerPoint design to showcase organization and assurance. Download this PPT slide to explore true perfection.
People who downloaded this PowerPoint presentation also viewed the following :
Content of this Powerpoint Presentation
Slide 1: This is the title slide for the Business Process Optimization Customer Onboarding Process.
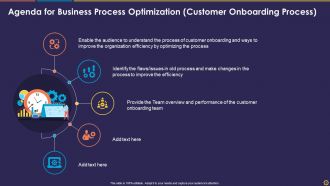
Slide 2: This slide shows the Agenda list for the Business Process Optimization Customer Onboarding Process with three additions already given.
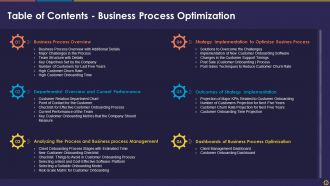
Slide 3: This slide displays the Table of Contents for Business Process Optimization covering Business Process Overview, Departmental Overview, and Current Performance, Analyzing the Process and Business Process Management, Dashboards of Business Process Optimization, Outcomes of Strategy Implementation, and Strategy Implementation to Optimize Business Process.
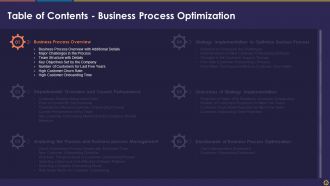
Slide 4: This slide introduces the Business Process Overview division of the presentation with Business Process Overview with Additional Details, Major Challenges in the Process, Team Structure with Details, Key Objectives Set by the Company, Number of Customers for Last Five Years, High Customer Churn Rate, and High Customer Onboarding Time.
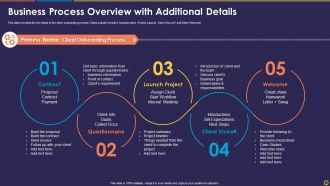
Slide 5: This slide shows the Business Process Overview with Additional Details. This slide provides the key steps of the client onboarding process including Contract, Questionnaire, Project Launch, Client Kick-off, and Client Welcome.
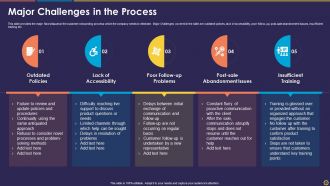
Slide 6: This slide provides the major challenges in the customer onboarding process which the company needs to eliminate. Major Challenges covered in the slide are outdated policies, lack of accessibility, poor follow-up, post-sale abandonment issues, insufficient training, etc.
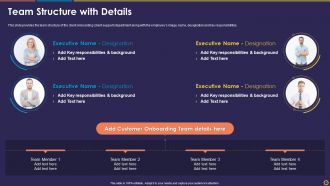
Slide 7: This slide presents the team structure of the client onboarding (client support) department along with the employee’s image, name, designation, and key responsibilities.
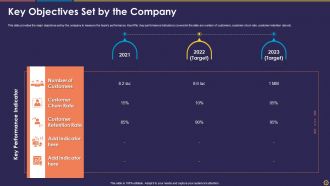
Slide 8: This slide shows the major objectives set by the company to measure the team’s performance. Key KPIs (key performance Indicators) covered in the slide are the number of customers, customer churn rate, and customer retention rate.
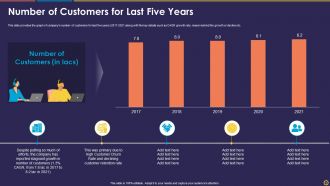
Slide 9: This slide displays a graph about the Number of Customers for the Last Five Years from 2017 to 2021 along with the key details such as CAGR growth rate, the reason behind the growth or decline, etc.
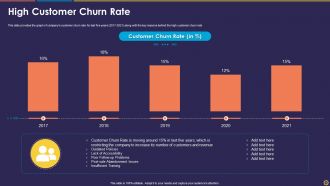
Slide 10: This slide provides the graph of the company’s customer churn rate for the last five years (2017-2021) along with the key reasons behind the high customer churn rate.
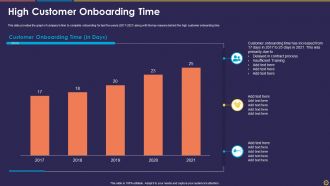
Slide 11: This slide illustrates High Customer Onboarding Time. It provides the graph of the company’s time to complete onboarding for the last five years (2017-2021) along with the key reasons behind the high customer onboarding time.
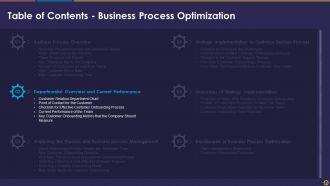
Slide 12: This slide introduces the Departmental Overview and Current Performance section of the presentation covering sub-topics such as Customer Relation Department Chart, Point of Contact for the Customer, Checklist for Effective Customer Onboarding Process, Current Performance of the Team, and Key Customer Onboarding Metrics that the Company Should Measure.
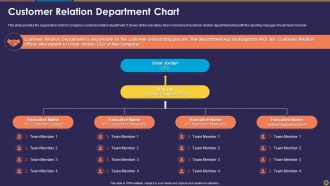
Slide 13: This slide provides the customer relation department organization chart of the company’s customer relation department. It shows all the executives /team members of the customer relations department along with the reporting manager of each team member.
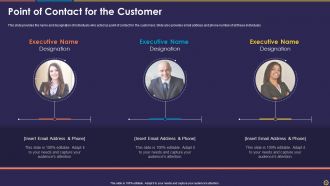
Slide 14: This slide shows the Point of Contact for the Customer. It provides the name and designation of individuals who acted as points of contact for the customers. The slide also provides the email addresses and phone numbers of all these individuals.
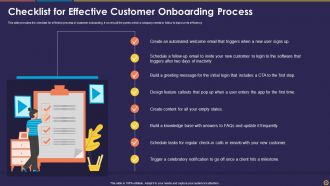
Slide 15: This slide displays a Checklist for Effective Customer Onboarding processes. It covers all the points which a company needs to follow to improve its efficiency Create an automated welcome email that triggers when a new user signs up.
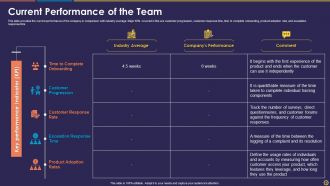
Slide 16: This slide showcases the Current Performance of the Team. It provides the current performance of the company in comparison with the industry average. Major KPIs covered in this are customer progression, customer response time, time to complete onboarding, product adoption rate, and escalation response time.
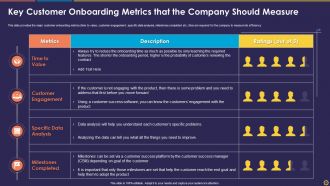
Slide 17: This slide gives insight into the Key Customer Onboarding Metrics that the Company Should Measure.
Slide 18: This slide introduces Analyzing the Process and Business process Management division of this presentation with sub-headings such as Client Onboarding Process Stages with Estimated Time, New Customer Onboarding Checklist, Checklist: Things to Avoid in Customer Onboarding Process, Selecting a Best and Cost-Effective Software Platform, Selecting a Suitable Onboarding Model, and Risk-Scale Matrix for Customer Onboarding.
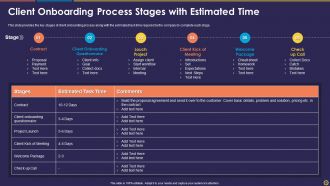
Slide 19: This slide shows the Client Onboarding Process Stages with Estimated Time such as Contract, Client Onboarding Questionnaire, Launch Project, Client Kick-off Meeting, Welcome Package, and Check-up Call.
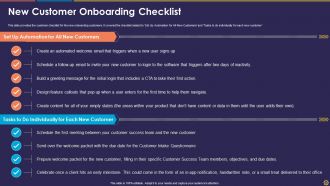
Slide 20: This slide provides a New Customer Onboarding Checklist. It covers the checklist related to ‘Set Up Automation for All-New Customers’ and ‘Tasks to do individually for each new customer'.
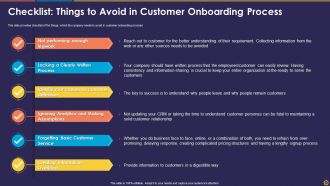
Slide 21: This slide provides a checklist of the things, which the company needs to avoid in the customer onboarding process.
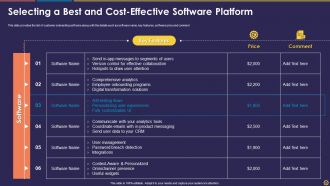
Slide 22: This slide displays Selecting the Best and Cost-Effective Software Platform. It provides the list of customer onboarding software along with the details such as software name, key features, software price, and comments.
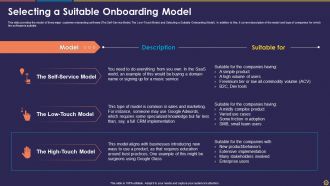
Slide 23: This slide shows the model of three major customer onboarding software (The Self-Service Model, The Low-Touch Model, and Selecting a Suitable Onboarding Model). In addition to this, it covers the description of the model and the type of companies for which the software is suitable.
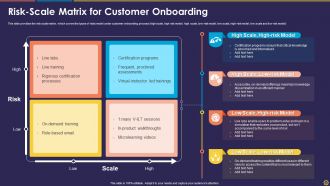
Slide 24: This slide provides the risk scale matrix for customer onboarding, which covers the types of risks model under the customer onboarding process (high scale, high-risk model; high scale, low-risk model; low scale, high-risk model; low scale and low-risk model).
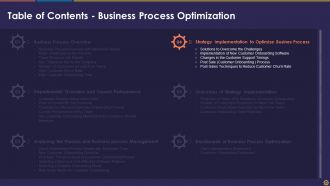
Slide 25: This slide introduces the Strategy Implementation to Optimize Business Process section of the deck with the following divisions. Solutions to Overcome the Challenges, Implementation of New Customer Onboarding Software, Changes in the Customer Support Timings, Post Sale (Customer Onboarding ) Process, and Post-Sales Techniques to Reduce Customer Churn Rate.
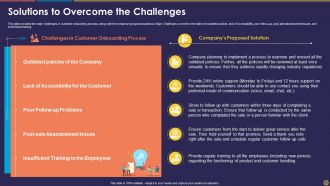
Slide 26: This slide shows the Solutions to Overcome the Challenges in the customer onboarding process, along with the company’s proposed solutions. Major Challenges covered in the slide are outdated policies, lack of accessibility, poor follow-up, post-sale abandonment issues, and insufficient training.
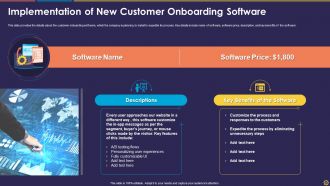
Slide 27: This slide displays the details about the Implementation of New Customer Onboarding Software which the company is planning to install to expedite its process. Key details include the name of the software, software price, description, and key benefits of the software.
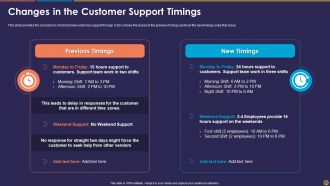
Slide 28: This slide showcases the Changes in the Customer Support Timings. It also shows the issues in the previous timings and how the new timings solve that issue.
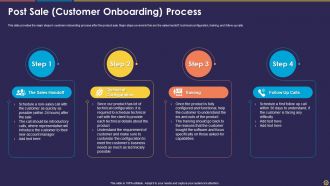
Slide 29: This slide provides the major steps in the customer onboarding process after the product sale. Major steps covered in this are the sales handoff, technical configuration, training, and follow-up calls.
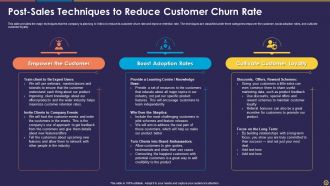
Slide 30: This slide demonstrates the Post-Sales Techniques to Reduce Customer Churn Rate. The techniques are classified under three categories empower the customer, boost adoption rates, and cultivate customer loyalty.
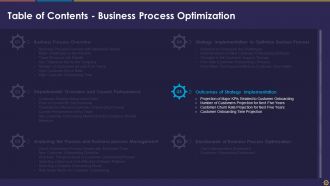
Slide 31: This slide introduces the Outcomes of the Strategy Implementation division of the presentation with the following sub-sections - Projection of Major KPIs Related to Customer Onboarding, Number of Customers Projection for Next Five Years, Customer Churn Rate Projection for Next Five Years, and Customer Onboarding Time Projection.
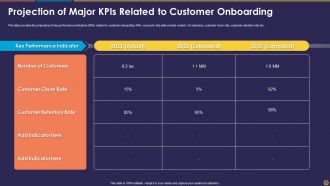
Slide 32: This slide shows the Projection of Major KPIs Related to Customer Onboarding. KPIs covered in this slide include number of customers, customer churn rate, customer retention rate.
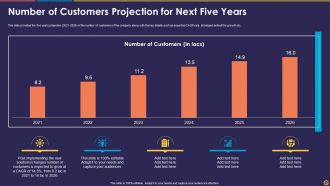
Slide 33: This slide displays the Number of Customers Projection for the Next Five Years from 2021 to 2026 along with the key details such as expected CAGR rate, strategies behind the growth, etc.
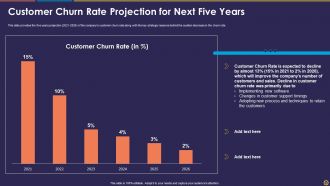
Slide 34: This slide provides the five years projection (2021-2026) of the company’s customer churn rate along with the key strategic reasons behind the sudden decrease in the churn rate.
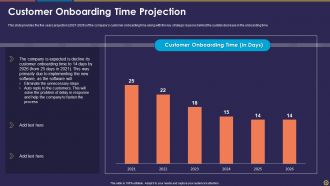
Slide 35: This slide illustrates the five years projection (2021-2026) of the company’s customer onboarding time along with the key strategic reasons behind the sudden decrease in the onboarding time.
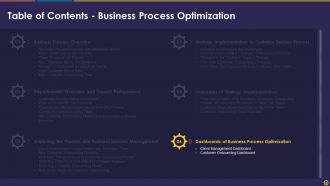
Slide 36: This slide introduces the Dashboards of Business Process Optimization division of this presentation with two subtopics including Client Management Dashboard, and Customer Onboarding Dashboard.
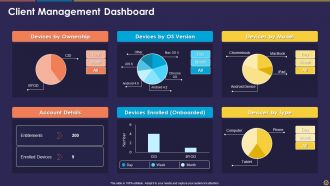
Slide 37: This slide shows the Client Management Dashboard covering Account Details, Devices by Ownership, Devices by OS Version, Devices by Type, Devices Enrolled (Onboarded), and Devices by Model.
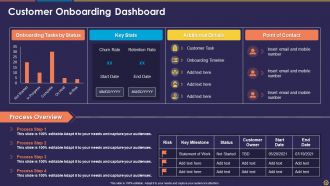
Slide 38: This slide displays the Customer Onboarding Dashboard with details about Onboarding Tasks by Status, Point of Contact, Additional Details, Key Stats, and Process Overview.
Slide 39: This slide illustrates the additional icons provided with the presentation on the Business Process Optimization Customer Onboarding Process.
Slide 40: This slide introduces the Additional Slides given with this presentaiton.
Slide 41: This slide is titled 'Our Mission' with sections on Vision, Mission, and Goal.
Slide 42: This slide shows our team with their names, designation, images, and profiles.
Slide 43: This slide displays Our Goals with a dartboard icon highlighting Customer, Target, and success.
Slide 44: This slide highlights key points About Us such as Target Audience, Premium Services, and Values Client.
Slide 45: This slide illustrates 4 Post It Notes text boxes to present important facts.
Slide 46: This slide shows a Venn diagram with four divisons.
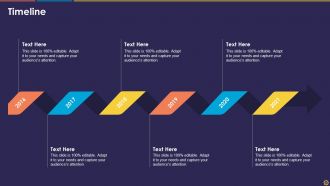
Slide 47: This slide displays a Timeline for six years from 2016 to 2021.
Slide 48: This slide shows four-part jigsaw Puzzle iconsto highlight data.
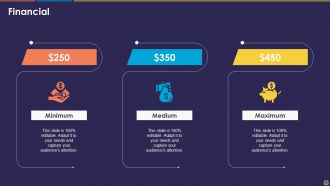
Slide 49: This slide presents the Financial stages for the company under Maximum, Medium, and Minimum levels.
Slide 50: This is the conclusive slide for this presentation with Thank You, Contact Number, Email Address, and Address.
Business process optimization customer onboarding process powerpoint presentation slides with all 50 slides:
Use our Business Process Optimization Customer Onboarding Process Powerpoint Presentation Slides to effectively help you save your valuable time. They are readymade to fit into any presentation structure.

FAQs for Business process optimization customer onboarding process
You'll see it working when your numbers actually improve - less time processing stuff, fewer handoffs, lower costs. Quality gets better with fewer screwups too. But honestly? The best sign is when your team stops complaining about those annoying bottlenecks. Happy employees stick with improvements way longer than miserable ones. Customer satisfaction usually jumps up since everything runs smoother and faster. Just make sure you're tracking the hard data before and after - oh, and don't forget to ask your team how they're feeling about the changes. Their feedback matters more than most people realize.
Ask your team what's driving them crazy - they'll point you straight to the worst stuff. Look for anything with tons of handoffs or where people are constantly redoing work. Those approval chains that take forever? Yeah, those too. I'd honestly just walk around and listen for complaints about processes taking way too long or causing errors. Check your metrics for high cycle times while you're at it. Map out maybe 3-5 of the biggest headaches, then start with whatever gives you the most bang for your buck. Don't pick the one that'll have everyone fighting you from day one.
Think of data analytics as your reality check for fixing processes. It shows you what's actually happening, not what you assume is going on. You'll spot where things get stuck, see how long stuff really takes, and figure out which steps matter versus the random busy work that somehow stuck around. Honestly, the coolest part is comparing before and after your changes - that's how you know if you actually fixed anything or just moved the problem around. Pick one process to start with. Measure the basics like time, cost, and how often things go wrong, then build from there.
Map out everything you're currently doing - literally every step. Talk to the people actually doing the work, not just their bosses who think they know what's happening (huge difference there). Sticky notes work great for this, honestly. Time each step and track where errors pop up. You'll spot the bottlenecks pretty quick. Look for redundant stuff and steps that don't really add value. Half the time what's actually happening is totally different from what's supposed to happen. Once you see the real picture, the fixes become obvious.
Look, automation's a game changer because it handles all that boring repetitive stuff nobody wants to do anyway. Your processes run way faster since they don't need coffee breaks or sleep. Less mistakes too. Start by picking your most annoying time-sucks - like invoice processing or customer onboarding. Honestly, anything that's super rule-based and makes you want to bang your head against your desk. Once you automate one thing and see how much time it saves, you'll want to automate everything (trust me on this). Meanwhile your team gets to work on actually interesting projects instead of copying data around all day.
Ugh, people HATE change - that's your biggest headache right there. Half your team will dig in their heels because the old way feels safer. Plus you probably don't even have good data on what you're currently doing wrong, which makes everything harder. Projects always spiral way beyond what you planned (scope creep is real), and measuring if it actually worked? Good luck with that. Oh, and your boss will want instant results while IT takes forever to get new systems talking to each other. Honestly though, just pick one small thing to fix first. Document what happens and celebrate quick wins - builds trust for the bigger stuff later.
Get your team involved from day one - they're doing the actual work, so they know what's broken. I've watched way too many "optimization" projects crash because managers thought they had all the answers. Form mixed teams where people can pitch ideas and actually see them happen. Let them own pieces of the improvements and make a big deal when stuff works out. Oh, and explain WHY you're changing things - not just "efficiency" but how it helps them too. Keep the feedback flowing both ways throughout the whole thing. Trust me, treating people like partners instead of obstacles makes all the difference.
Honestly, don't go crazy with metrics or you'll drown in data. Pick like 4-6 max and stick with the basics: cycle time, cost per transaction, error rates, customer satisfaction. Track employee productivity too since that actually moves the needle. Get your baseline numbers first though - can't improve what you don't measure, right? I'd check these monthly, not daily (learned that the hard way). Oh and here's the thing - don't just chase speed improvements. I've watched teams cut processing time in half while their error rates went through the roof. Quality matters just as much. Start tracking this stuff now so you have real data when you're ready to make changes.
Honestly, customer feedback is like getting a free diagnosis of what's broken in your processes. People will straight-up tell you when wait times suck or when they have to repeat their info five times - that's gold right there. I'd collect it through surveys, support chats, whatever works. Then map those complaints to actual process steps. Don't chase every single gripe though. Look for patterns instead. If ten people complain about the same confusing checkout step, boom - you know exactly what to fix first. It's way better than guessing what needs work.
Honestly, AI and machine learning are huge right now for spotting bottlenecks before they happen and automating decisions instantly. RPA takes care of all that boring repetitive stuff so your team can actually think strategically. Cloud platforms connect everything and scale easily. There's this thing called process mining that's actually pretty fascinating - it digs through your real data to show you exactly where things are getting stuck. Low-code platforms are great because you don't have to wait forever for IT to build something. My advice? Start small with whatever's driving you crazy first.
Honestly, just start by watching one process this week and see where things get stuck. Map out what's actually happening vs what should happen - you'll be shocked at the waste. Try the "5 whys" thing to dig into root problems instead of band-aid fixes. Your frontline people are gold here since they deal with the mess daily, so get them involved in spotting inefficiencies. Set up regular team huddles where everyone can pitch small improvements. Oh, and value stream mapping sounds fancy but it's just tracking where time disappears. Pick something simple first - don't overthink it.
Honestly, working across teams is a game changer for process stuff. You'll actually see how things flow from start to finish instead of just your little corner. Different people catch problems that others miss completely - like, marketing might spot something ops never would. Getting everyone involved early means they won't fight you later when you roll out changes. That's huge. The trick is having actual workers there, not just their bosses who haven't touched the process in years. Oh, and the creative solutions you get? Way better than what one department comes up with alone.
Look, if you're not constantly tweaking your processes, they'll get stale fast. Markets shift, tech evolves - your competitors will eat your lunch while you're still doing things the 2015 way. It's honestly like refusing to update your phone's OS. Map out one process that's driving your team crazy right now. Where are the actual bottlenecks? What's slowing you down? Those regular check-ins help you cut waste and respond to customers way faster than the "we've always done it this way" crowd. Pick something small to start - don't overthink it.
Honestly, regulatory stuff is like having speed bumps everywhere - you gotta work around them. Map out what you can't touch before you start brainstorming improvements. Healthcare and finance are brutal with this. I learned that the hard way when we spent weeks on a workflow redesign that compliance shot down immediately. But don't let it kill your creativity! There's usually room to optimize within the rules. Just bring your legal team into the conversation early - they're actually pretty helpful once you get them talking.
Toyota completely changed manufacturing with their lean system - they basically invented the whole "eliminate waste" thing everyone copies now. Amazon's warehouse game is insane too, using predictive analytics to cut delivery times way down. Then there's GE with Six Sigma, which sounds boring but actually worked really well for reducing defects. Honestly, the key is figuring out which specific processes they focused on first and how they tracked improvements. That's your best bet for spotting where you can optimize your own stuff. Each company picked different areas but the measurement part was crucial.
-
Excellent work done on template design and graphics.
-
Visually stunning presentation, love the content.
-
Very well designed and informative templates.
-
Great designs, really helpful.
-
Unique design & color.
-
Graphics are very appealing to eyes.
-
Understandable and informative presentation.
-
Perfect template with attractive color combination.
-
Helpful product design for delivering presentation.
-
The Designed Graphic are very professional and classic.
-
Page:
- You're currently reading page 1
- Page 2
-
