48018937 style circular loop 6 piece powerpoint presentation diagram infographic slide
The social impact of data analytics is immense. We’ve seen how data can be used to fuel revolutions, sway opinions and even topple governments. But all this power comes with a great responsibility. We at Slideteam believe that it is our duty to use data in a way that benefits society as a whole. That’s why we’ve created a library of data analytics ppt templates that you can use to make your own presentations on the social impact of data analytics. So what are you waiting for? Grab our data analytics ppt templates now and start making your voice heard.
The social impact of data analytics is immense. We’ve seen how data can be used to fuel revolutions, sway opinions and even..
- Google Slides is a new FREE Presentation software from Google.
- All our content is 100% compatible with Google Slides.
- Just download our designs, and upload them to Google Slides and they will work automatically.
- Amaze your audience with SlideTeam and Google Slides.
-
Want Changes to This PPT Slide? Check out our Presentation Design Services
- WideScreen Aspect ratio is becoming a very popular format. When you download this product, the downloaded ZIP will contain this product in both standard and widescreen format.
-

- Some older products that we have may only be in standard format, but they can easily be converted to widescreen.
- To do this, please open the SlideTeam product in Powerpoint, and go to
- Design ( On the top bar) -> Page Setup -> and select "On-screen Show (16:9)” in the drop down for "Slides Sized for".
- The slide or theme will change to widescreen, and all graphics will adjust automatically. You can similarly convert our content to any other desired screen aspect ratio.
Compatible With Google Slides

Get This In WideScreen
You must be logged in to download this presentation.
PowerPoint presentation slides
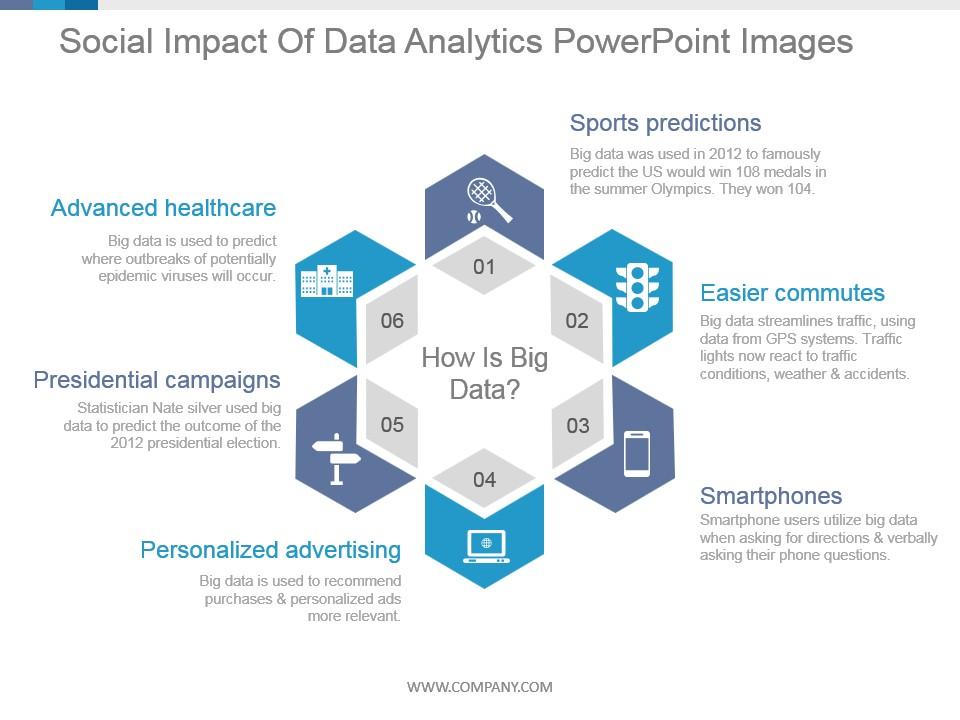
Presenting social impact of data analytics powerpoint images. This is a social impact of data analytics powerpoint images. This is a six stage process. The stages in this process are how is big data, sports predictions, easier commutes, smartphones, personalized advertising, presidential campaigns, advanced healthcare.
48018937 style circular loop 6 piece powerpoint presentation diagram infographic slide with all 5 slides:
Use our Social Impact Of Data Analytics Powerpoint Images to effectively help you save your valuable time. They are readymade to fit into any presentation structure.
-
Awesome use of colors and designs in product templates.
-
Topic best represented with attractive design.


