47514453 style essentials 2 financials 2 piece powerpoint presentation diagram infographic slide
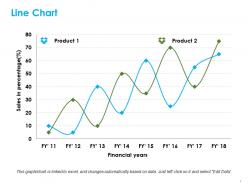
A line chart presentation template is a type of chart template which displays information as data points series and these points connected by a straight-line segment. The basic line chart slide is very common in various fields. A run chart PowerPoint slide is often used to visualize the trend in data over time intervals or time series. A user can take help of line graph PPT template to represent data in chronological order. With the help of line chart example presentation slide, a presenter can illustrate the tedious and lengthy calculations in statistics of different fields such as collection, organization, measurement, as well as analysis of the numerical data. You can use this line graph PowerPoint template for discussing the quantity rather than quality. The line chart summary PPT slide makes easy to describe the huge amount of data as sometimes, it becomes tough to discuss or work with such a huge amount of data. The run graph template is a pictorial representation of the numerical information. A user can edit the numerical values of line chart excel presentation slide as this slide gets linked with the Excel spreadsheet. A business owner can use the sale line graph example PPT slide in his presentation to illustrate the comparison between the sale of two products or even a comparison of the current status of two projects. Give folks cause to join hands with our Line Chart Ppt Summary Templates. Establish the basis for instituting accord.
- Google Slides is a new FREE Presentation software from Google.
- All our content is 100% compatible with Google Slides.
- Just download our designs, and upload them to Google Slides and they will work automatically.
- Amaze your audience with SlideTeam and Google Slides.
-
Want Changes to This PPT Slide? Check out our Presentation Design Services
- WideScreen Aspect ratio is becoming a very popular format. When you download this product, the downloaded ZIP will contain this product in both standard and widescreen format.
-

- Some older products that we have may only be in standard format, but they can easily be converted to widescreen.
- To do this, please open the SlideTeam product in Powerpoint, and go to
- Design ( On the top bar) -> Page Setup -> and select "On-screen Show (16:9)” in the drop down for "Slides Sized for".
- The slide or theme will change to widescreen, and all graphics will adjust automatically. You can similarly convert our content to any other desired screen aspect ratio.
Compatible With Google Slides

Get This In WideScreen
You must be logged in to download this presentation.
PowerPoint presentation slides
Presenting line chart PPT summary templates PPT slide. The line graph summary PowerPoint template designed by the professionals of SlideTeam to describe the huge amount of data. The run chart slide value gets edited as a user can link this slide with the Excel Sheet. The line chart summary slide is customizable in PowerPoint. The sale line graph example template is also compatible with Google Slide. A user can do modification such as font size, font type, color and dimensions in the run chart template to present the desired comparison between two things.
47514453 style essentials 2 financials 2 piece powerpoint presentation diagram infographic slide with all 5 slides:
Our Line Chart Ppt Summary Templates enable better distribution. Your ideas get across to a bigger audience.
-
Content of slide is easy to understand and edit.
-
Best way of representation of the topic.


