All Excel Linked Powerpoint Diagram Slide
-
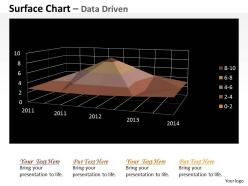 Data driven 3d numeric values surface chart powerpoint slides
We are proud to present our data driven 3d numeric values surface chart powerpoint slides. Our Data Driven 3D Numeric Values Surface Chart Powerpoint slides Power Point Templates Are The Strands Of Your Mental Loom. Weave Them Together And Produce A Magical Tapestry. Our Data Driven 3D Numeric Values Surface Chart Powerpoint slides Power Point Templates Provide Windows To Your Brilliant Mind. Open Them To Your Audience And Impress Them With Your Knowledge.
-
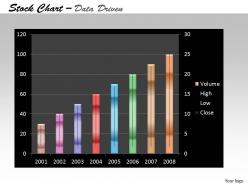 Data driven stock chart for business growth powerpoint slides
We are proud to present our data driven stock chart for business growth powerpoint slides. Bubbling And Bursting With Ideas Are You. Let Our Data Driven Stock Chart For Business Growth Powerpoint slides Power Point Templates Give Them The Shape For You. You Have Gained Great Respect For Your Brilliant Ideas. Use Our Data Driven Stock Chart For Business Growth Powerpoint slides Power Point Templates To Strengthen And Enhance Your Reputation.
-
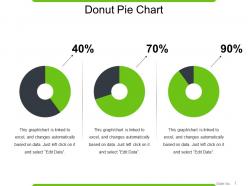 63495974 style division pie-donut 3 piece powerpoint presentation diagram infographic slide
Presenting Donut Pie Chart PowerPoint Shapes. Get this completely customizable slide and make changes in it to match it to your presentation theme. Modify the colors, background, text, and the icon. The number of points can be increased or decreased as per your choice. Adjust the shape and size of the image. Transform and save it in various formats, including JPG and PDF file formats. It is compatible with the Google Slides, and the major Microsoft versions. Can be viewed clearly on full screen because of its splendid picture quality.
-
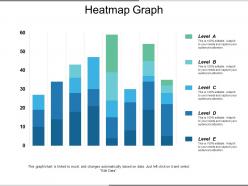 19413284 style essentials 2 financials 5 piece powerpoint presentation diagram infographic slide
Presenting the Heatmap Graph PowerPoint theme which is designed professionally for your convenience. Open and save your presentation in various formats like PDF, JPG, and PNG. You can freely access your presentation in both 4:3 and 16:9 aspect ratio. Alter the font, color, font size, and font types of the slides as per your needs. This template is compatible with Google Slides which makes it easily accessible at once.
-
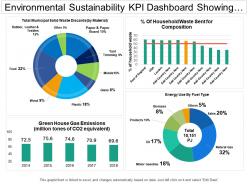 42217199 style division pie 4 piece powerpoint presentation diagram infographic slide
Presenting this set of slides with name - Environmental Sustainability Kpi Dashboard Showing Municipal Solid Waste Discard. This is a four stage process. The stages in this process are Environment Sustainability, Environment Continual, Environment Feasibility.
-
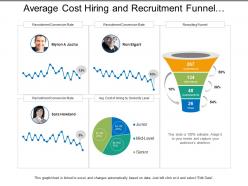 29546045 style layered funnel 3 piece powerpoint presentation diagram infographic slide
Presenting this set of slides with name - Average Cost Hiring And Recruitment Funnel Dashboard. This is a three stage process. The stages in this process are Staffing Plan, Recruitment, Staff Management.
-
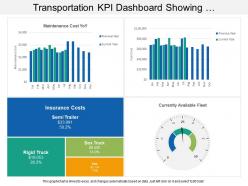 41253460 style essentials 2 dashboard 4 piece powerpoint presentation diagram infographic slide
Presenting transportation KPI dashboard showing maintenance cost insurance cost available fleet PowerPoint slide. Simple data input with linked Excel chart, just right click to input values. This PowerPoint theme is fully supported by Google slides. Picture quality of these slides does not change even when project on large screen. Fast downloading speed and formats can be easily changed to JPEG and PDF applications. This template is suitable for marketing, sales persons, business managers and entrepreneurs. Adjust PPT layout, font, text and color as per your necessity.
-
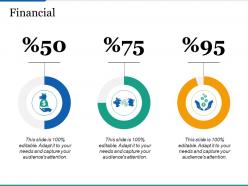 56016393 style essentials 2 financials 3 piece powerpoint presentation diagram infographic slide
This is a three stage process. The stage in this process are Business, Management, Finance, Analysis, Strategy.
-
 56812819 style essentials 2 financials 3 piece powerpoint presentation diagram infographic slide
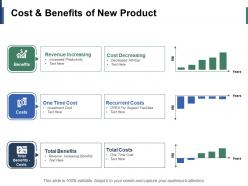
Presenting this set of slides with name - Cost And Benefits Of New Product Ppt Infographic Template Example Introduction. This is a three stage process. The stages in this process are Benefits, Cost, Revenue Increasing, Cost Decreasing, Recurrent Costs.
-
 17759744 style essentials 2 dashboard 2 piece powerpoint presentation diagram infographic slide
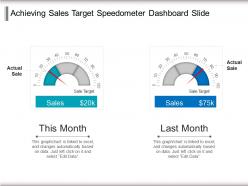
Presenting achieving sales target speedometer dashboard slide PPT inspiration presentation template. The dashboard slide is compatible with Google Slides. A user may add his organization's logo and alter template according to his organization’s brand. Since the template is 100% editable in PowerPoint and all the graphics which include background, themes, font size, font type, aspect ratios, and shapes are fully customizable. Template's quality remains the same, even after doing changes in it. The excel linked template is also compatible with other formats such as JPEG and PDF.
-
 66203355 style division donut 3 piece powerpoint presentation diagram infographic slide
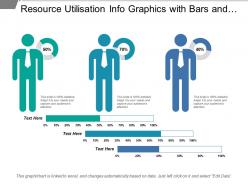
Presenting this set of slides with name - Resource Utilisation Info Graphics With Bars And Graphs. This is a three stage process. The stages in this process are Resource Management, Resource Utilization, Resource Allocation.
-
 9150461 style essentials 2 financials 4 piece powerpoint presentation diagram infographic slide
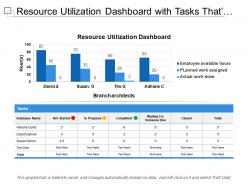
Presenting this set of slides with name - Resource Utilization Dashboard With Tasks Thats Not Completed In Progress Completed. This is a four stage process. The stages in this process are Resource Management, Resource Utilization, Resource Allocation.
-
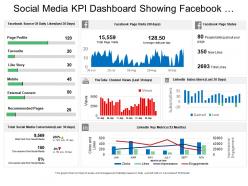 73902800 style essentials 2 financials 5 piece powerpoint presentation diagram infographic slide
Presenting this set of slides with name - Social Media Kpi Dashboard Showing Facebook Page Stats Youtube Channel Views. This is a five stage process. The stages in this process are Social Media, Digital Marketing, Social Marketing.
-
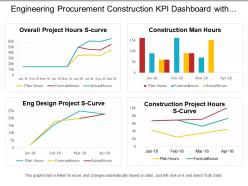 16274214 style essentials 2 financials 4 piece powerpoint presentation diagram infographic slide
Presenting this set of slides with name - Engineering Procurement Construction Kpi Dashboard With Project Hours S Curve. This is a four stage process. The stages in this process are Engineering, Procurement And Construction, Construction Management, Engineering, Purchasing And Construction .
-
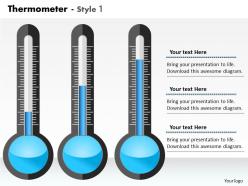 0414 thermometer design column chart powerpoint graph
PPT slide supports resize, recolor and reverse the images. Good quality images can be used to compliment and reinforce message. Works well in Windows 7, 8, 10, XP, Vista and Citrix. Editing in presentation slide show can be done from anywhere by any device. PDF integrated features help to convert PPT to PDF. Supports to work offline and later upload the changes.
-
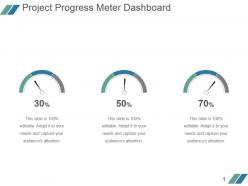 47103565 style essentials 2 dashboard 3 piece powerpoint presentation diagram infographic slide
Presenting project progress meter dashboard powerpoint slide designs download. This is a project progress meter dashboard powerpoint slide designs download. This is a three stage process. The stages in this process are business, marketing, dashboard, percentage.
-
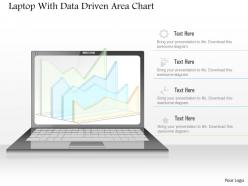 1214 laptop with data driven area chart powerpoint slide
We are proud to present our 1214 laptop with data driven area chart powerpoint slide. Graphic of laptop and area chart has been used to craft this power point template slide. This PPT slide contains the concept of data analysis for any business process. This PPT slide can be used for any business presentation.
-
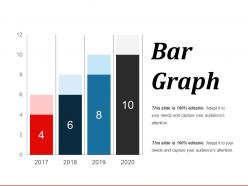 90186381 style concepts 1 growth 4 piece powerpoint presentation diagram infographic slide
Presenting bar graph powerpoint slide rules. This is a bar graph powerpoint slide rules. This is a four stage process. The stages in this process are bar graph, growth, product, business, marketing.
-
 68896409 style division pie 4 piece powerpoint presentation diagram infographic slide
Presenting Pie Chart PowerPoint Slides. This PPT theme is available in both 4:3 and 16:9 aspect ratios. This PowerPoint template is customizable so you can modify the font size, font type, color and shapes as per your requirements. This PPT presentation is Google Slides compatible hence it is easily accessible. You can download and save this PowerPoint layout in different formats like PDF, PNG, and JPG.
-
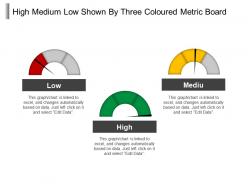 23824483 style essentials 2 dashboard 3 piece powerpoint presentation diagram infographic slide
Presenting this set of slides with name - High Medium Low Shown By Three Coloured Metric Board. This is a three stage process. The stages in this process are High Medium Low, High Moderate Low, Top Medium Low.
-
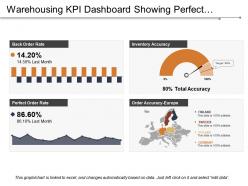 58461 style essentials 2 financials 4 piece powerpoint presentation diagram infographic slide
PPT design can instantly be downloaded as JPEG and PDF formats. Design template is easily editable, the best advantage of this business oriented PPT design is the use of excel linked charts, where charts in PPT design will automatically get changed when you update storage related figures on linked excel sheet. The PPT design is fully compatible with Google Slides and MS PowerPoint software. Design can be viewed both in standard and full screen view.
-
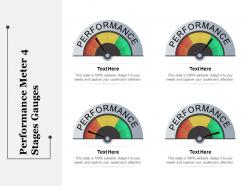 1776903 style essentials 2 dashboard 4 piece powerpoint presentation diagram infographic slide
Get a chance to explore, the performance meter PowerPoint Presentation Slide. This Presentation has been designed by professionals and is fully editable. You can reshape the font size, font type, colors, and even the background. This Template is attainable with Google Slide and can be saved in JPG or PDF format without any nuisance created. Fast download at the click of the button.
-
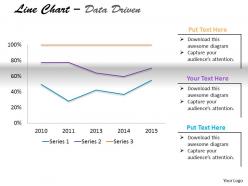 Data driven market analysis line chart powerpoint slides
We are proud to present our data driven market analysis line chart powerpoint slides. This Line chart is ideal for showing trends over time. A standard example would be how the stock value for a certain company develops over time. Impress upon audience with this PPT diagram
-
 79934490 style essentials 1 our team 4 piece powerpoint presentation diagram infographic slide
Presenting sales team target and achievement ppt examples slides. This is a sales team target and achievement ppt examples slides. This is a four stage process. The stages in this process are target achievement, john allen, anita smith, peter smith, mary smith, jan, feb, mar.
-
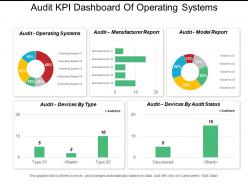 18075649 style essentials 2 financials 5 piece powerpoint presentation diagram template slide
Presenting this set of slides with name - Audit Kpi Dashboard Of Operating Systems Manufacturer Report And Model Report. This is a five stage process. The stages in this process are Audit, Examine, Survey.
-
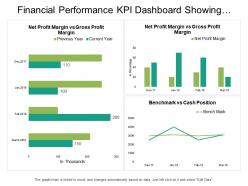 81603876 style essentials 2 financials 4 piece powerpoint presentation diagram infographic slide
Presenting this set of slides with name - Financial Performance Kpi Dashboard Showing Benchmark Vs Cash Position. This is a four stage process. The stages in this process are Financial Performance, Financial Report, Financial Review.
-
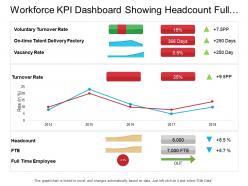 53214381 style essentials 2 financials 3 piece powerpoint presentation diagram infographic slide
Presenting this set of slides with name - Workforce Kpi Dashboard Showing Headcount Full Time Employee And Turnover Rate. This is a three stage process. The stages in this process are Staff, Personnel, Workforce.
-
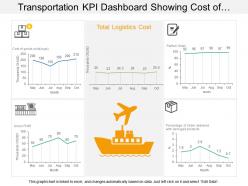 8839611 style essentials 2 financials 2 piece powerpoint presentation diagram infographic slide
Presenting KPI dashboard showing cost of goods sold logistics cost and gross profit PPT slide. This layout is fully compatible with Google slides and data driven. User can edit the data in linked excel sheet and graphs and charts gets customized accordingly. Easy to put in company logo, trademark or name; accommodate words to support the key points. Images do no distort out even when they are projected on large screen. Adjust colors, text and fonts as per your business requirements
-
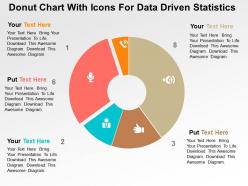 Donut chart with icons for data driven statistics powerpoint slides
Businessmen, micro, small and medium enterprises can use the PPT visual as a master slide. PowerPoint presentation supports filling background in a different color from the text. All images are 100% editable in the presentation slide. Text can be differentiated form the background by the handy features provided by PPT layout. There is no space constrain in the PowerPoint design, thus enabling easy addition or edition of data.
-
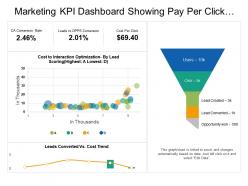 44993197 style essentials 2 financials 3 piece powerpoint presentation diagram infographic slide
Presenting this set of slides with name - Marketing Kpi Dashboard Showing Pay Per Click Campaign Optimization. This is a three stage process. The stages in this process are Marketing, Branding, Promoting.
-
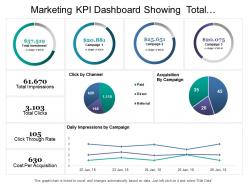 52553811 style division donut 4 piece powerpoint presentation diagram infographic slide
Presenting marketing KPI dashboard showing total investment impressions click cost per acquisition PPT slide. This layout is fully compatible with Google slides and data driven. User can edit the data in linked excel sheet and graphs and charts gets customized accordingly. Easy to put in company logo, trademark or name; accommodate words to support the key points. Images do no distort out even when they are projected on large screen. Adjust colors, text and fonts as per your business requirements
-
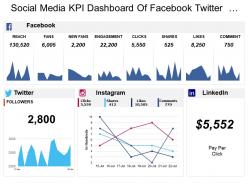 53848885 style essentials 2 financials 4 piece powerpoint presentation diagram infographic slide
Presenting this set of slides with name - Social Media Kpi Dashboard Of Facebook Twitter Instagram Clicks Followers. This is a four stage process. The stages in this process are Social Media, Digital Marketing, Social Marketing.
-
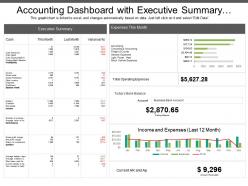 20985052 style essentials 2 financials 4 piece powerpoint presentation diagram infographic slide
Presenting accounting dashboard with executive summary and monthly expenses PPT slideshow. Makes the information clear in the mind of the audience. Editable visuals, colors and charts. Easy to edit and customize as per your needs. Beneficial for industry professionals, technologists, managers, executives, researchers, sales people, etc. Flexible presentation designs can be presented in standard and widescreen view. Has a futuristic and realistic approach. Privilege of insertion of logo and trademarks for more personalization. Easy to download and save. Highly beneficial PowerPoint Slide for highlighting financial data.
-
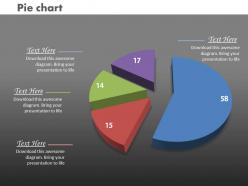 0414 pie chart with data division powerpoint graph
We are proud to present our 0414 pie chart with data division powerpoint graph. Our Pie Chart With Data Division Powerpoint Graph Power Point Templates Offer You The Needful To Organize Your Thoughts. Use Them To List Out Your Views In A Logical Sequence. Our Pie Chart With Data Division Powerpoint Graph Power Point Templates Are Created By A Hardworking Bunch Of Busy Bees. Always Flitting Around With Solutions Guaranteed To Please.
-
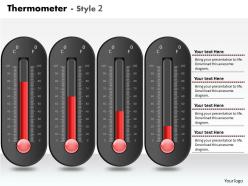 0414 thermometer 4 staged column chart powerpoint graph
We are proud to present our 0414 thermometer 4 staged column chart powerpoint graph. Our Thermometer 4 Staged Column Chart Powerpoint Graph Powerpoint Templates are the layers of your gourmet cake. Provide the icing of your ideas and produce a masterpiece. Use our Thermometer 4 Staged Column Chart Powerpoint Graph Powerpoint Templates and and feel the difference. Right off they generate a surge of interest.
-
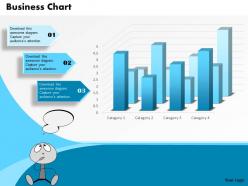 0514 3d bar graph data driven business chart diagram powerpoint slides
They are superlative designed PowerPoint visuals useful for management professionals, business analysts and researchers etc. These are wholly amendable PPT layouts, designs, forms, shades and icons etc. These PPT graphics can be acclimating with other software and all Google slides. They are spectacularly conceived pictorial Presentation templates which can be easily convertible into PDF or JPG file layouts. They provide high quality visuals.
-
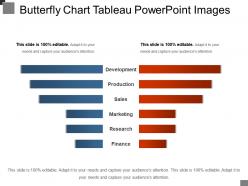 75093516 style essentials 2 compare 2 piece powerpoint presentation diagram infographic slide
Presenting Butterfly Chart Table. This template is Excel-linked and data driven. Edit the excel sheet as per your data and the chart will customize automatically. You can also make alterations in the font type, font size, and background colors as per your requirements. This template is completely compatible with Google Slides and can be transformed into JPG and PDF formats. Download this butterfly template in standard screen (4:3) and widescreen (16:9)
-
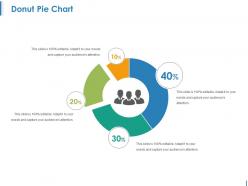 9137099 style division donut 4 piece powerpoint presentation diagram infographic slide
Presenting this set of slides with name - Donut Pie Chart Ppt Examples. This is a four stage process. The stages in this process are Donut Pie Chart, Finance, Marketing, Strategy, Analysis.
-
 22473637 style essentials 2 financials 2 piece powerpoint presentation diagram template slide
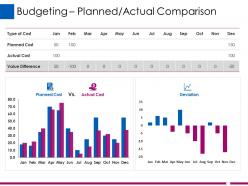
Presenting this set of slides with name - Budgeting Planned Actual Comparison Ppt Layouts. This is a two stage process. The stages in this process are Finance, Business, Analysis, Marketing, Planning.
-
 23612104 style essentials 2 financials 6 piece powerpoint presentation diagram infographic slide
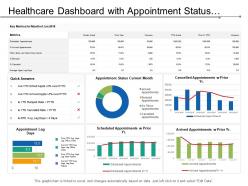
Presenting this set of slides with name - Healthcare Dashboard With Appointment Status Current Month. This is a six stage process. The stages in this process are Healthcare, Health Improvement, Medical Care.
-
 1977365 style essentials 2 financials 8 piece powerpoint presentation diagram infographic slide
Presenting this set of slides with name - Government And Public Works Kpi Dashboard Showing Criminal Records. This is a eight stage process. The stages in this process are Government And Public Works, Government And Public Tasks.
-
 5619954 style essentials 2 financials 3 piece powerpoint presentation diagram template slide
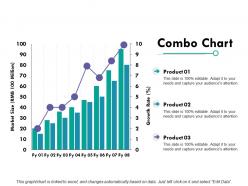
Presenting this set of slides with name - Combo Chart Finance Ppt Powerpoint Presentation Diagram Graph Charts. This is a three stage process. The stages in this process are Combo Chart, Product, Growth Rate, Market Size, Finance.
-
 53600398 style essentials 2 financials 2 piece powerpoint presentation diagram infographic slide
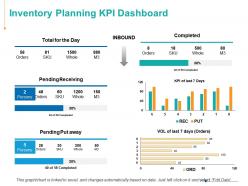
Presenting this set of slides with name - Inventory Planning KPI Dashboard Ppt Powerpoint Presentation Icon. This is a two stage process. The stages in this process are Finance, Analysis, Business, Investment, Marketing.
-
 3867447 style essentials 2 financials 3 piece powerpoint presentation diagram infographic slide
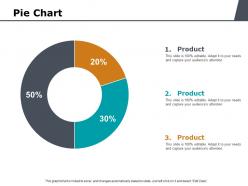
Presenting this set of slides with name - Pie Chart Investment Ppt Powerpoint Presentation Templates. This is a three stages process. The stages in this process are Pie Chart, Finance, Marketing, Business, Analysis.
-
 45265744 style essentials 2 compare 2 piece powerpoint presentation diagram infographic slide
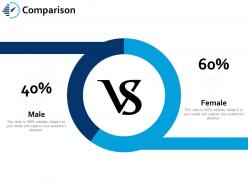
Presenting this set of slides with name - Comparison Ppt Portfolio Information. This is a two stage process. The stages in this process are Business, Management, Strategy, Analysis, Comparison.
-
 Two scientific thermometer for calculation powerpoint slides
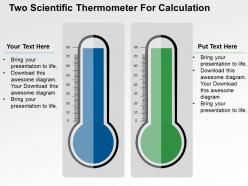
They act as a perfect mode for the transfer of information from organisation to the viewers. An error free environment can be created with these designs. True and Accurate information is delivered to the spectators. Simple steps are need to be followed in order to download or edit them. They display professionalism. They are technology and result oriented.
-
 83393039 style essentials 2 dashboard 4 piece powerpoint presentation diagram infographic slide
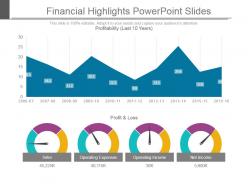
Presenting financial highlights powerpoint slides. This is a financial highlights powerpoint slides. This is a four stage process. The stages in this process are profit and loss, sales, operating expenses, operating income, net income.
-
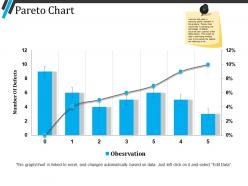 57399992 style essentials 2 financials 7 piece powerpoint presentation diagram infographic slide
Presenting pareto chart powerpoint templates. This is a pareto chart powerpoint templates. This is a seven stage process. The stages in this process are pareto chart, business, growth, finance, analysis.
-
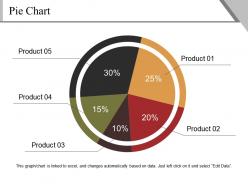 44495939 style division pie 5 piece powerpoint presentation diagram infographic slide
Presenting pie chart ppt background template. This is a pie chart ppt background template. This is a five stage process. The stages in this process are pie, finance, business, marketing, strategy.
-
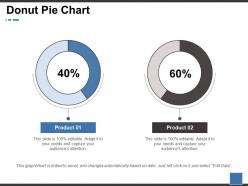 42219778 style division donut 2 piece powerpoint presentation diagram infographic slide
Explore the donut pie chart PowerPoint presentation slide. This presentation has been designed by professionals and is fully editable. You can reshape the font size, font type, colors, and even the background. This Template is attainable with Google Slide and can be saved in JPG or PDF format without any resistance created during the process. Fast download at the click of the button provided below.
-
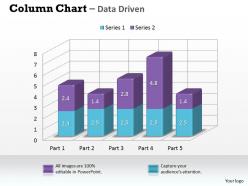 Data driven 3d column chart for market surveys powerpoint slides
We are proud to present our data driven 3d column chart for market surveys powerpoint slides. Our Data Driven 3D Column Chart For Market Surveys Powerpoint Slides Power Point Templates Give You The Basic Framework Of Your Talk. Give It The Shape You Desire With Your Wonderful Views. Our Data Driven 3D Column Chart For Market Surveys Powerpoint Slides Power Point Templates Are The Lungs Of Your Talk. Fill Them With The Oxygen Of Your In-depth Thought Process.
-
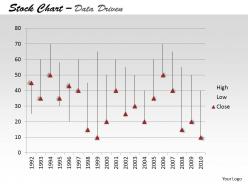 Data driven ineract with stock chart powerpoint slides
We are proud to present our data driven ineract with stock chart powerpoint slides. You Have All The Ingredients To Create The Taste Of Success. Garnish Your Recipe With Our Data Driven Ineract With Stock Chart Powerpoint slides Power Point Templates And Enhance Its Flavor. Our Data Driven Ineract With Stock Chart Powerpoint slides Power Point Templates Are Created By Innovative Young Minds. Guaranteed To Fit Presentations Of All Kinds.
-
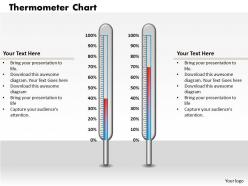 0414 thermometer column chart to compare data powerpoint graph
We are proud to present our 0414 thermometer column chart to compare data powerpoint graph. Timeline crunches are a fact of life. Meet all deadlines using our Thermometer Column Chart To Compare Data Powerpoint Graph Powerpoint Templates. Connect the dots using our Thermometer Column Chart To Compare Data Powerpoint Graph Powerpoint Templates. Fan expectations as the whole picture emerges.
-
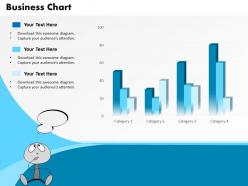 0514 3d bar graph for data driven sales result display powerpoint slides
Delicately projected PPT template congruous for the business and marketing management scholars etc., Conversant with all Google slides and different software functions, sleek and smooth downloading available which saves time, Rebuild able backgrounds, style, matter, figures etc, easily insert able company logo, emblem or trademark, High quality PPT visuals which remain unaffected when projected on wide screen, exportable to other file formats such as PDF or JPG.
-
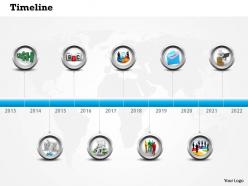 0514 business marketing time line diagram powerpoint slides
PPT icon is easy for proofing and editing. Combination of text and flash animation. Presentation slide supports new shape styles to keep away cliché appearance and helps capture the attention. PPT slide is compatible with Google slide. High resolution. Font style and size can be easily altered and entered. PPT visual offers high color resolution
-
 73105254 style division pie 4 piece powerpoint presentation diagram infographic slide
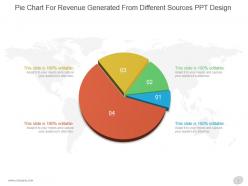
Presenting pie chart for revenue generated from different sources ppt design. This is a pie chart for revenue generated from different sources ppt design. This is a four stage process. The stages in this process are business, marketing, pie, circle, piece.
-
 4925780 style essentials 2 financials 3 piece powerpoint presentation diagram template slide
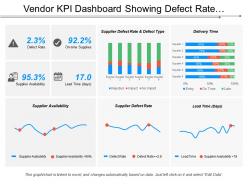
Presenting this set of slides with name - Vendor Kpi Dashboard Showing Defect Rate On-Time Suppliers And Lead Time. This is a stage process. The stages in this process are Vendor, Supplier, Retailer.
-
 97390645 style essentials 2 financials 4 piece powerpoint presentation diagram infographic slide
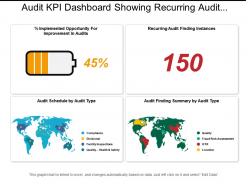
Presenting this set of slides with name - Audit Kpi Dashboard Showing Recurring Audit Finding Instances And Audit Finding Summary. This is a four stage process. The stages in this process are Audit, Examine, Survey.
-
 16912769 style essentials 2 financials 3 piece powerpoint presentation diagram template slide
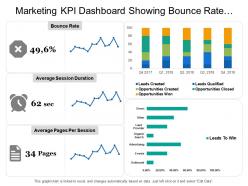
Presenting this set of slides with name - Marketing Kpi Dashboard Showing Bounce Rate Average Session Duration. This is a three stage process. The stages in this process are Marketing, Branding, Promoting.
-
 55406444 style essentials 2 financials 6 piece powerpoint presentation diagram infographic slide
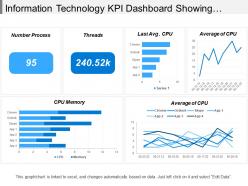
Presenting this set of slides with name - Information Technology Kpi Dashboard Showing Cpu Memory Average Of Cpu. This is a six stage process. The stages in this process are Information Technology, It, Iot.


