All Excel Linked Powerpoint Diagram Slide
-
 Transportation mode vehicles carpooled by industry of workers 16 years and over in us from 2015-17
Presenting this set of slides with name - Transportation Mode Vehicles Carpooled By Industry Of Workers 16 Years And Over In Us From 2015-17. Means Of Transportation Vehicles Carpooled To Work By Industry Of Workers 16 Years And Over In The U.S From 2015 To 17. This is part of our Data and Statistics products selection, and you will need a Paid account to download the actual report with accurate data. Downloaded report will contain the actual editable graph with the actual data, an excel table with the actual data, the exact source of the data and the release date.This Graph Shows The Means Of Transportation Car, Truck, Or Van Carpooled To Work By Industry Agriculture, Construction, Wholesale Trade, Information, Finance And Insurance, Public Administration, Armed Forces Etc Of Workers 16 Years And Over In The U.S From The Years 2015 To 17. It covers topic Means Of Transportation By Vehicles Carpooled To Work for region USA and is for date range 2015 To 17. Download it immediately and use it for your business.
-
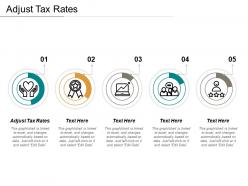 22470837 style essentials 2 financials 5 piece powerpoint presentation diagram infographic slide
Presenting this set of slides with name - Adjust Tax Rates Ppt Powerpoint Presentation Gallery Ideas Cpb. This is an editable five stages graphic that deals with topics like Adjust Tax Rates to help convey your message better graphically. This product is a premium product available for immediate download, and is 100 percent editable in Powerpoint. Download this now and use it in your presentations to impress your audience.
-
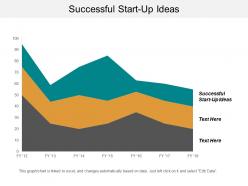 47646413 style essentials 2 financials 3 piece powerpoint presentation diagram infographic slide
Presenting this set of slides with name - Successful Start Up Ideas Ppt Powerpoint Presentation Icon Design Inspiration Cpb. This is an editable three stages graphic that deals with topics like Successful Start Up Ideas to help convey your message better graphically. This product is a premium product available for immediate download, and is 100 percent editable in Powerpoint. Download this now and use it in your presentations to impress your audience.
-
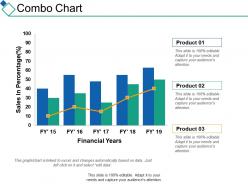 61089538 style essentials 2 financials 3 piece powerpoint presentation diagram infographic slide
Presenting this set of slides with name - Combo Chart Finance Investment Ppt Summary Designs Download. This is a three stage process. The stages in this process are Combo Chart, Finance, Analysis, Business, Investment.
-
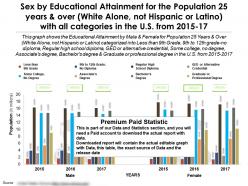 Education achievement by sex with all categories for 25 years white alone not hispanic in us 2015-17
Presenting this set of slides with name - Education Achievement By Sex With All Categories For 25 Years White Alone Not Hispanic In US 2015-17. Sex By Educational Attainment For The Population 25 Years And Over White Alone Not Hispanic Or Latino With All Categories In The U.S From 2015 to 17. This is part of our Data and Statistics products selection, and you will need a Paid account to download the actual report with accurate data. Downloaded report will contain the actual editable graph with the actual data, an excel table with the actual data, the exact source of the data and the release date. This graph shows the Educational Attainment by Male and Female for Population 25 Years and Over White Alone Not Hispanic or Latino categorized into Less than 9th Grade, 9th to 12th grade no diploma Regular high school diploma, GED or alternative credential, Some college, no degree, Associates degree, Bachelors degree and Graduate or professional degree in the U.S from 2015 to 2017. It covers topic Educational Attainment for White Alone Not Hispanic or Latino with grades by sex for region USA and is for date range 2015 to 17. Download it immediately and use it for your business.
-
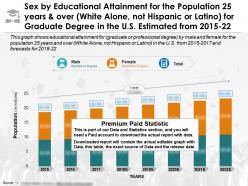 Education completion for 25 years white alone not latino for graduate degree in us 2015-22
Presenting this set of slides with name - Education Completion For 25 Years White Alone Not Latino For Graduate Degree In US 2015-22. Sex By Educational Attainment For The Population 25 Years And Over White Alone Not Hispanic Or Latino For Graduate Degree In The U.S Estimated From 2015 to 22. This is part of our Data and Statistics products selection, and you will need a Paid account to download the actual report with accurate data. Downloaded report will contain the actual editable graph with the actual data, an excel table with the actual data, the exact source of the data and the release date. This graph shows Educational Attainment for Graduate or professional degree by Male and Female for the population 25 years and over White Alone Not Hispanic Or Latino in the U.S from 2015 to 2017 and Forecasts for 2018 to 22. It covers topic Educational Attainment for Graduate or professional degree for region USA and is for date range 2015 to 22. Download it immediately and use it for your business.
-
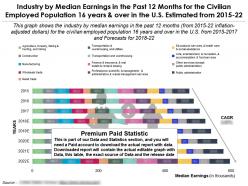 Industry by median earnings in past 12 months civilian employed population 16 years in us 2015-22
Presenting this set of slides with name - Industry By Median Earnings In Past 12 Months Civilian Employed Population 16 Years In US 2015-22. Industry By Median Earnings In The Past 12 Months For The Civilian Employed Population 16 Years And Over In The U.S Estimated From 2015 to 22. This is part of our Data and Statistics products selection, and you will need a Paid account to download the actual report with accurate data. Downloaded report will contain the actual editable graph with the actual data, an excel table with the actual data, the exact source of the data and the release date. This graph shows the industry by median earnings in the past 12 months from 2015 to 22 inflation adjusted dollars for the civilian employed population 16 years and over in the U.S from 2015 to 2017 and Forecasts for 2018 to 22. It covers topic Industry by median earnings for population 16 years and over for region USA and is for date range 2015 to 22. Download it immediately and use it for your business.
-
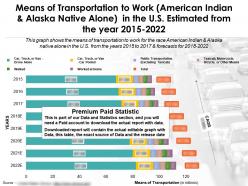 Means of transportation to work american indian alaska native alone in us year 2015-2022
Presenting this set of slides with name - Means Of Transportation To Work American Indian Alaska Native Alone In US Year 2015-2022. Means Of Transportation To Work American Indian And Alaska Native Alone In The U.S Estimated From The Year 2015 to 2022. This is part of our Data and Statistics products selection, and you will need a Paid account to download the actual report with accurate data. Downloaded report will contain the actual editable graph with the actual data, an excel table with the actual data, the exact source of the data and the release date. This graph shows the means of transportation to work for the race American Indian and Alaska Native Alone in the U.S from the years 2015 to 2017 and forecasts for 2018 to 2022. It covers topic Means of Transportation to Work for American Indian for region USA and is for date range 2015 to 22. Download it immediately and use it for your business.
-
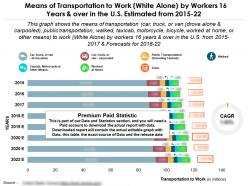 Means of transportation to work white alone by workers 16 years over in us 2015-22
Presenting this set of slides with name - Means Of Transportation To Work White Alone By Workers 16 Years Over In US 2015-22. Means Of Transportation To Work White Alone By Workers 16 Years And Over In The U.S Estimated From 2015 to 22. This is part of our Data and Statistics products selection, and you will need a Paid account to download the actual report with accurate data. Downloaded report will contain the actual editable graph with the actual data, an excel table with the actual data, the exact source of the data and the release date. This graph shows the means of transportation car, truck, or van drove alone and carpooled, public transportation, walked, taxicab, motorcycle, bicycle, worked at home, or other means to work White Alone by workers 16 years and over in the U.S from 2015 to 2017 and Forecasts for 2018 to 22. It covers topic Means of transportation to work for White Alone for region USA and is for date range 2015 to 22. Download it immediately and use it for your business.
-
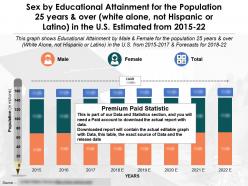 Sex by educational attainment population 25 years white alone not hispanic or latino in us 2015-22
Presenting this set of slides with name - Sex By Educational Attainment Population 25 Years White Alone Not Hispanic Or Latino In US 2015-22. Sex By Educational Attainment For The Population 25 Years And Over White Alone Not Hispanic Or Latino In The U.S Estimated From 2015 to 22. This is part of our Data and Statistics products selection, and you will need a Paid account to download the actual report with accurate data. Downloaded report will contain the actual editable graph with the actual data, an excel table with the actual data, the exact source of the data and the release date. This graph shows Educational Attainment by Male and Female for the population 25 years and over White Alone Not Hispanic Or Latino in the U.S from 2015 to 2017 and Forecasts for 2018 to 22. It covers topic Educational Attainment for White Alone Not Hispanic or Latino for region USA and is for date range 2015 to 22. Download it immediately and use it for your business.
-
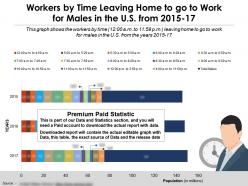 Workers by time leaving home to go to work for males in us 2015-17
Presenting this set of slides with name - Workers By Time Leaving Home To Go To Work For Males In US 2015-17. Workers By Time Leaving Home To Go To Work For Males In The U.S From 2015 to 17. This is part of our Data and Statistics products selection, and you will need a Paid account to download the actual report with accurate data. Downloaded report will contain the actual editable graph with the actual data, an excel table with the actual data, the exact source of the data and the release date. This graph shows the workers by time 12.00 a.m to 11.59 p.m leaving home to go to work for males in the U.S from the years 2015 to 17. It covers topic Workers by time leaving home to go to work for males for region USA and is for date range 2015 to 17. Download it immediately and use it for your business.
-
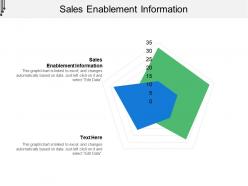 22945235 style essentials 2 financials 2 piece powerpoint presentation diagram infographic slide
Presenting this set of slides with name - Sales Enablement Information Ppt Powerpoint Presentation Slides Skills Cpb. This is an editable two stages graphic that deals with topics like Sales Enablement Information to help convey your message better graphically. This product is a premium product available for immediate download, and is 100 percent editable in Powerpoint. Download this now and use it in your presentations to impress your audience.
-
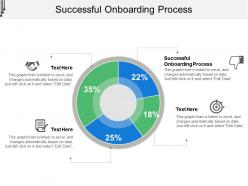 75079899 style essentials 2 financials 4 piece powerpoint presentation diagram infographic slide
Presenting this set of slides with name - Successful Onboarding Process Ppt Powerpoint Presentation Styles Clipart Cpb. This is an editable four stages graphic that deals with topics like Successful Onboarding Process to help convey your message better graphically. This product is a premium product available for immediate download, and is 100 percent editable in Powerpoint. Download this now and use it in your presentations to impress your audience.
-
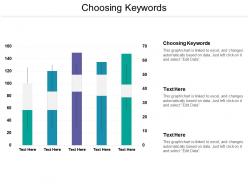 83146385 style essentials 2 financials 3 piece powerpoint presentation diagram infographic slide
Presenting this set of slides with name - Choosing Keywords Ppt Powerpoint Presentation Pictures Graphics Cpb. This is an editable three stages graphic that deals with topics like Choosing Keywords to help convey your message better graphically. This product is a premium product available for immediate download, and is 100 percent editable in Powerpoint. Download this now and use it in your presentations to impress your audience.
-
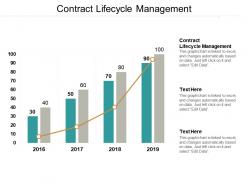 86206010 style essentials 2 financials 3 piece powerpoint presentation diagram infographic slide
Presenting this set of slides with name - Contract Lifecycle Management Ppt Powerpoint Presentation Pictures Shapes Cpb. This is an editable three stages graphic that deals with topics like Contract Lifecycle Management to help convey your message better graphically. This product is a premium product available for immediate download, and is 100 percent editable in Powerpoint. Download this now and use it in your presentations to impress your audience.
-
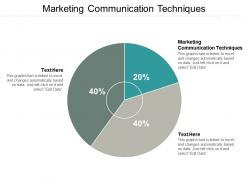 36376811 style essentials 2 financials 3 piece powerpoint presentation diagram infographic slide
Presenting this set of slides with name - Marketing Communication Techniques Ppt Powerpoint Presentation Pictures Graphics Download Cpb. This is an editable three stages graphic that deals with topics like Marketing Communication Techniques to help convey your message better graphically. This product is a premium product available for immediate download, and is 100 percent editable in Powerpoint. Download this now and use it in your presentations to impress your audience.
-
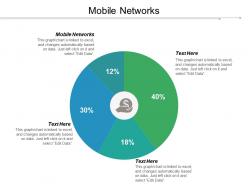 53844407 style essentials 2 financials 4 piece powerpoint presentation diagram infographic slide
Presenting this set of slides with name - Mobile Networks Ppt Powerpoint Presentation Pictures Graphics Tutorials Cpb. This is an editable four stages graphic that deals with topics like Mobile Networks to help convey your message better graphically. This product is a premium product available for immediate download, and is 100 percent editable in Powerpoint. Download this now and use it in your presentations to impress your audience.
-
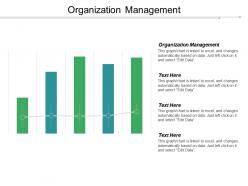 99216438 style essentials 2 financials 4 piece powerpoint presentation diagram infographic slide
Presenting this set of slides with name - Organization Management Ppt Powerpoint Presentation Pictures Icons Cpb. This is an editable four stages graphic that deals with topics like Organization Management to help convey your message better graphically. This product is a premium product available for immediate download, and is 100 percent editable in Powerpoint. Download this now and use it in your presentations to impress your audience.
-
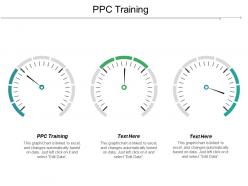 79686737 style essentials 2 financials 3 piece powerpoint presentation diagram infographic slide
Presenting this set of slides with name - Ppc Training Ppt Powerpoint Presentation Pictures Summary Cpb. This is an editable three stages graphic that deals with topics like Ppc Training to help convey your message better graphically. This product is a premium product available for immediate download, and is 100 percent editable in Powerpoint. Download this now and use it in your presentations to impress your audience.
-
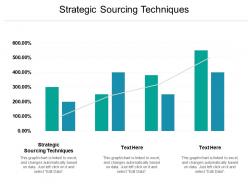 62279574 style essentials 2 financials 3 piece powerpoint presentation diagram infographic slide
Presenting this set of slides with name - Strategic Sourcing Techniques Ppt Powerpoint Presentation Pictures Information Cpb. This is an editable three stages graphic that deals with topics like Strategic Sourcing Techniques to help convey your message better graphically. This product is a premium product available for immediate download, and is 100 percent editable in Powerpoint. Download this now and use it in your presentations to impress your audience.
-
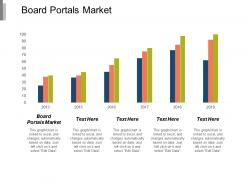 15774825 style essentials 2 financials 5 piece powerpoint presentation diagram infographic slide
Presenting this set of slides with name - Board Portals Market Ppt Powerpoint Presentation Gallery Display Cpb. This is an editable five stages graphic that deals with topics like Board Portals Market to help convey your message better graphically. This product is a premium product available for immediate download, and is 100 percent editable in Powerpoint. Download this now and use it in your presentations to impress your audience.
-
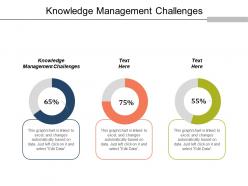 54602892 style essentials 2 financials 3 piece powerpoint presentation diagram infographic slide
Presenting this set of slides with name - Knowledge Management Challenges Ppt Powerpoint Presentation Icon Backgrounds Cpb. This is an editable three stages graphic that deals with topics like Knowledge Management Challenges to help convey your message better graphically. This product is a premium product available for immediate download, and is 100 percent editable in Powerpoint. Download this now and use it in your presentations to impress your audience.
-
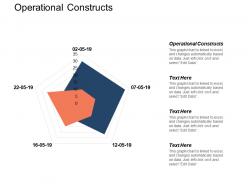 21902301 style essentials 2 financials 5 piece powerpoint presentation diagram infographic slide
Presenting this set of slides with name - Operational Constructs Ppt Powerpoint Presentation Icon Background Designs Cpb. This is an editable five stages graphic that deals with topics like Operational Constructs to help convey your message better graphically. This product is a premium product available for immediate download, and is 100 percent editable in Powerpoint. Download this now and use it in your presentations to impress your audience.
-
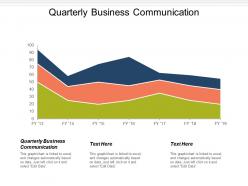 6994395 style essentials 2 financials 3 piece powerpoint presentation diagram infographic slide
Presenting this set of slides with name - Quarterly Business Communication Ppt Powerpoint Presentation Icon Rules Cpb. This is an editable three stages graphic that deals with topics like Quarterly Business Communication to help convey your message better graphically. This product is a premium product available for immediate download, and is 100 percent editable in Powerpoint. Download this now and use it in your presentations to impress your audience.
-
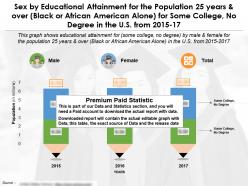 Education completion by sex for 25 years over black african american alone some college no degree in us 2015-17
Presenting this set of slides with name - Education Completion By Sex For 25 Years Over Black African American Alone Some College No Degree In US 2015-17. Sex By Educational Attainment For The Population 25 Years And Over Black Or African American Alone For Some College No Degree In The U.S From 2015 To 17. This is part of our Data and Statistics products selection, and you will need a Paid account to download the actual report with accurate data. Downloaded report will contain the actual editable graph with the actual data, an excel table with the actual data, the exact source of the data and the release date.This Graph Shows Educational Attainment For Some College No Degree By Male And Female For The Population 25 Years And Over Black Or African American Alone In The U.S From 2015 To 2017. It covers topic Educational Attainment For Some College No Degree By Sex for region USA and is for date range 2015 To 17. Download it immediately and use it for your business.
-
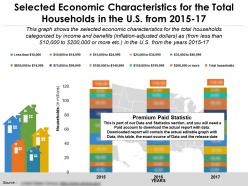 Selected economic characteristics for the total households in the us from 2015-17
Presenting this set of slides with name - Selected Economic Characteristics For The Total Households In The US From 2015-17. Selected Economic Characteristics For The Total Households In The U.S From 2015 To 17. This is part of our Data and Statistics products selection, and you will need a Paid account to download the actual report with accurate data. Downloaded report will contain the actual editable graph with the actual data, an excel table with the actual data, the exact source of the data and the release date.This Graph Shows The Selected Economic Characteristics For The Total Households Categorized By Income And Benefits Inflation Adjusted Dollars As From Less Than Dollar 10,000 To Dollar 200,000 Or More Etc In The U.S From The Years 2015 To 17. It covers topic Selected Economic Characteristics For The Total Households for region USA and is for date range 2015 To 17. Download it immediately and use it for your business.
-
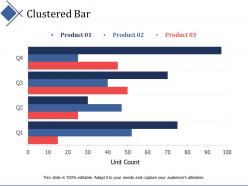 74249421 style essentials 2 financials 3 piece powerpoint presentation diagram infographic slide
Presenting this set of slides with name - Clustered Bar Investment Ppt Summary Infographic Template. This is a three stage process. The stages in this process are Finance, Analysis, Business, Investment, marketing.
-
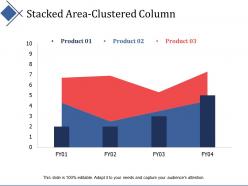 35357125 style essentials 2 financials 3 piece powerpoint presentation diagram infographic slide
Presenting this set of slides with name - Stacked Area Clustered Column Finance Investment Ppt Summary Infographic Template. This is a three stage process. The stages in this process are Area Chart, Finance, Marketing, Analysis, Investment.
-
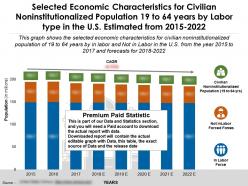 Selected economic characteristics for noninstitutionalized 19 to 64 years by labor type in us 2015-22
Presenting this set of slides with name - Selected Economic Characteristics For Noninstitutionalized 19 To 64 Years By Labor Type In US 2015-22. Selected Economic Characteristics For Civilian Noninstitutionalized Population 19 To 64 Years By Labor Type In The U.S Estimated From 2015 To 2022. This is part of our Data and Statistics products selection, and you will need a Paid account to download the actual report with accurate data. Downloaded report will contain the actual editable graph with the actual data, an excel table with the actual data, the exact source of the data and the release date.This Graph Shows The Selected Economic Characteristics For Civilian Noninstitutionalized Population Of 19 To 64 Years By In Labor And Not In Labor In The U.S From The Year 2015 To 2017 And Forecasts For 2018 To 2022. It covers topic Selected Economic Characteristics For 19 To 64 Years for region USA and is for date range 2015 To 22. Download it immediately and use it for your business.
-
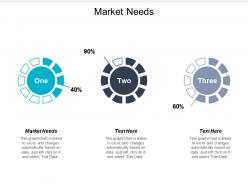 46583830 style essentials 2 financials 3 piece powerpoint presentation diagram infographic slide
Presenting this set of slides with name - Market Needs Ppt Powerpoint Presentation Icon Inspiration Cpb. This is an editable three stages graphic that deals with topics like Market Needs to help convey your message better graphically. This product is a premium product available for immediate download, and is 100 percent editable in Powerpoint. Download this now and use it in your presentations to impress your audience.
-
 41153894 style hierarchy mind-map 3 piece powerpoint presentation diagram infographic slide
Presenting this set of slides with name - Marketing Sales Controlling Ppt Powerpoint Presentation Icon Show Cpb. This is an editable three stages graphic that deals with topics like Marketing Sales Controlling to help convey your message better graphically. This product is a premium product available for immediate download, and is 100 percent editable in Powerpoint. Download this now and use it in your presentations to impress your audience.
-
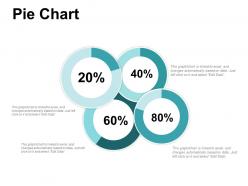 30674345 style essentials 2 financials 4 piece powerpoint presentation diagram infographic slide
Presenting this set of slides with name - Pie Chart Finance Ppt Powerpoint Presentation Inspiration Background Designs. This is a four stage process. The stages in this process are Pie Chart, Finance, Marketing, Business, Analysis.
-
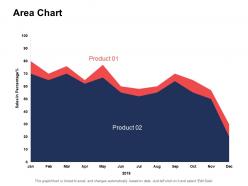 64458384 style essentials 2 financials 2 piece powerpoint presentation diagram infographic slide
Presenting this set of slides with name - Area Chart Ppt Powerpoint Presentation Inspiration Background Images. This is a two stage process. The stages in this process are Area Chart, Finance, Marketing, Business, Analysis.
-
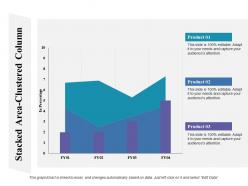 8661938 style essentials 2 financials 3 piece powerpoint presentation diagram infographic slide
Presenting this set of slides with name - Stacked Area Clustered Column Ppt Show Deck. This is a three stages process. The stages in this process are Stacked Area Chart, Finance, Marketing, Business, Analysis.
-
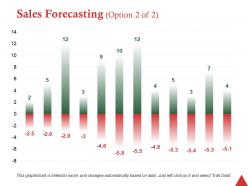 8419051 style essentials 2 financials 2 piece powerpoint presentation diagram infographic slide
Presenting this set of slides with name - Sales Forecasting Option 2 Of 2 Ppt Professional Picture. This is a two stage process. The stages in this process are Business, Management, Strategy, Analysis, Marketing.
-
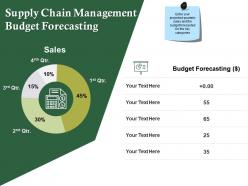 42659573 style division donut 4 piece powerpoint presentation diagram infographic slide
Presenting this set of slides with name - Supply Chain Management Budget Forecasting Ppt Professional Samples. This is a four stage process. The stages in this process are Business, Management, Strategy, Analysis, Marketing.
-
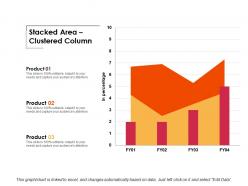 94727531 style essentials 2 financials 3 piece powerpoint presentation diagram infographic slide
Presenting this set of slides with name - Stacked Area Clustered Column Ppt Professional Information. This is a three stage process. The stages in this process are Business, Management, Strategy, Analysis, Marketing.
-
 34646067 style essentials 2 financials 3 piece powerpoint presentation diagram infographic slide
Presenting this set of slides with name - Clustered Bar Ppt Powerpoint Presentation Pictures Examples. This is a three stage process. The stages in this process are Strategy, Business, Marketing, Management, Analysis.
-
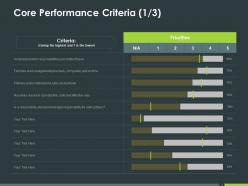 67752457 style essentials 2 financials 5 piece powerpoint presentation diagram infographic slide
Presenting this set of slides with name - Core Performance Criteria 1 3 Ppt Powerpoint Presentation Pictures Guidelines. This is a five stage process. The stages in this process are Finance, Business, Marketing, Management, Analysis.
-
 27230790 style essentials 2 financials 3 piece powerpoint presentation diagram infographic slide
Presenting this set of slides with name - Stacked Bar Ppt Powerpoint Presentation Styles Example Introduction. This is a three stage process. The stages in this process are Finance, Business, Marketing, Management, Analysis.
-
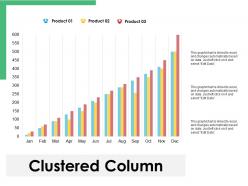 84791584 style essentials 2 financials 3 piece powerpoint presentation diagram infographic slide
Presenting this set of slides with name - Clustered Column Ppt Powerpoint Presentation Professional Example Introduction. This is a three stage process. The stages in this process are Strategy, Business, Marketing, Management, Analysis.
-
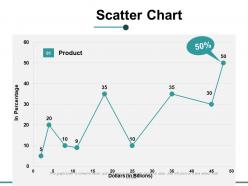 44632987 style essentials 2 financials 1 piece powerpoint presentation diagram infographic slide
Presenting this set of slides with name - Scatter Chart Finance Ppt Powerpoint Presentation Visual Aids Layouts. This is a one stages process. The stages in this process are Finance, Marketing, Management, Investment, Analysis.
-
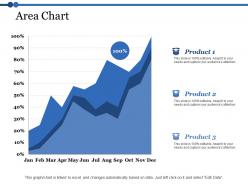 87306153 style essentials 2 financials 3 piece powerpoint presentation diagram infographic slide
Presenting this set of slides with name - Area Chart Finance Ppt Powerpoint Presentation Diagram Ppt. This is a three stages Process. The stages in this process are Finance, Marketing, Management, Investment, Analysis.
-
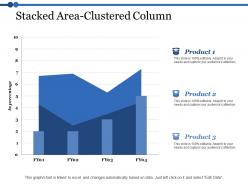 67376248 style essentials 2 financials 3 piece powerpoint presentation diagram infographic slide
Presenting this set of slides with name - Stacked Area Clustered Column Ppt Powerpoint Presentation File Gallery. This is a three stages Process. The stages in this process are Finance, Marketing, Management, Investment, Analysis.
-
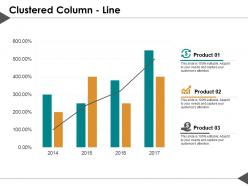 88512949 style concepts 1 growth 3 piece powerpoint presentation diagram infographic slide
Presenting this set of slides with name - Clustered Column Line Ppt Visual Aids Backgrounds. This is a three stage process. The stages in this process are Percentage, Product, Business, Management, Marketing.
-
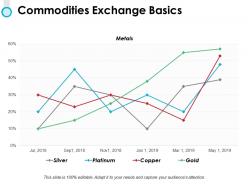 50155313 style essentials 2 financials 4 piece powerpoint presentation diagram infographic slide
Presenting this set of slides with name - Commodities Exchange Basics Ppt Powerpoint Presentation File Example File. This is a four stage process. The stages in this process are Percentage, Product, Business, Management, Marketing.
-
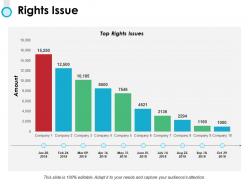 66824105 style concepts 1 growth 10 piece powerpoint presentation diagram infographic slide
Presenting this set of slides with name - Rights Issue Ppt Powerpoint Presentation File Structure. This is a ten stage process. The stages in this process are Percentage, Product, Business, Management, Marketing.
-
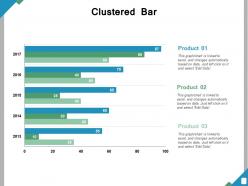 43027596 style essentials 2 financials 3 piece powerpoint presentation diagram infographic slide
Presenting this set of slides with name - Clustered Bar Ppt Powerpoint Presentation File Diagrams. This is a three stage process. The stages in this process are Percentage, Product, Management, Marketing, Business.
-
 30584018 style essentials 2 financials 3 piece powerpoint presentation diagram infographic slide
Presenting this set of slides with name - Business Strategy Value Chain Ppt Powerpoint Presentation Infographic Template Diagrams Cpb. This is an editable three stages graphic that deals with topics like Business Strategy Value Chain to help convey your message better graphically. This product is a premium product available for immediate download, and is 100 percent editable in Powerpoint. Download this now and use it in your presentations to impress your audience.
-
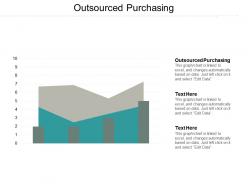 90541104 style essentials 2 financials 3 piece powerpoint presentation diagram infographic slide
Presenting this set of slides with name - Outsourced Purchasing Ppt Powerpoint Presentation Layouts File Formats Cpb. This is an editable three stages graphic that deals with topics like Outsourced Purchasing to help convey your message better graphically. This product is a premium product available for immediate download, and is 100 percent editable in Powerpoint. Download this now and use it in your presentations to impress your audience.
-
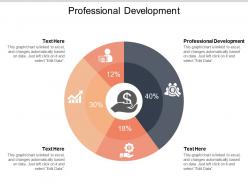 33681349 style essentials 2 financials 4 piece powerpoint presentation diagram infographic slide
Presenting this set of slides with name - Professional Development Ppt Powerpoint Presentation Model Design Inspiration Cpb. This is an editable four stages graphic that deals with topics like Professional Development to help convey your message better graphically. This product is a premium product available for immediate download, and is 100 percent editable in Powerpoint. Download this now and use it in your presentations to impress your audience.
-
 55519693 style essentials 2 financials 3 piece powerpoint presentation diagram infographic slide
Presenting this set of slides with name - Purchasing Consultancy Ppt Powerpoint Presentation Model Example Topics Cpb. This is an editable three stages graphic that deals with topics like Purchasing Consultancy to help convey your message better graphically. This product is a premium product available for immediate download, and is 100 percent editable in Powerpoint. Download this now and use it in your presentations to impress your audience.
-
 33568506 style essentials 2 financials 2 piece powerpoint presentation diagram infographic slide
Presenting this set of slides with name - Supplier Intelligence Ppt Powerpoint Presentation Outline Background Images Cpb. This is an editable two stages graphic that deals with topics like Supplier Intelligence to help convey your message better graphically. This product is a premium product available for immediate download, and is 100 percent editable in Powerpoint. Download this now and use it in your presentations to impress your audience.
-
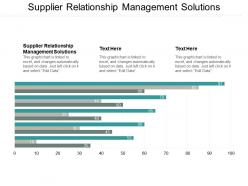 33879372 style essentials 2 financials 3 piece powerpoint presentation diagram infographic slide
Presenting this set of slides with name - Supplier Relationship Management Solutions Ppt Powerpoint Presentation Outline Backgrounds Cpb. This is an editable three stages graphic that deals with topics like Supplier Relationship Management Solutions to help convey your message better graphically. This product is a premium product available for immediate download, and is 100 percent editable in Powerpoint. Download this now and use it in your presentations to impress your audience.
-
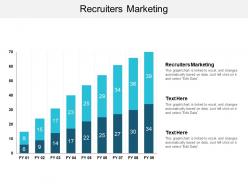 55884947 style essentials 2 financials 3 piece powerpoint presentation diagram infographic slide
Presenting this set of slides with name - Recruiters Marketing Ppt Powerpoint Presentation Infographic Template Deck Cpb. This is an editable three stages graphic that deals with topics like Recruiters Marketing to help convey your message better graphically. This product is a premium product available for immediate download, and is 100 percent editable in Powerpoint. Download this now and use it in your presentations to impress your audience.
-
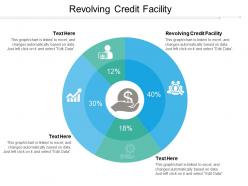 34458768 style essentials 2 financials 4 piece powerpoint presentation diagram infographic slide
Presenting this set of slides with name - Revolving Credit Facility Ppt Powerpoint Presentation Infographic Template Files Cpb. This is an editable four stages graphic that deals with topics like Revolving Credit Facility to help convey your message better graphically. This product is a premium product available for immediate download, and is 100 percent editable in Powerpoint. Download this now and use it in your presentations to impress your audience.
-
 Means of transportation taxicab or other means by occupation of workers 16 years over in us 2015-22
Presenting this set of slides with name - Means Of Transportation Taxicab Or Other Means By Occupation Of Workers 16 Years Over In US 2015-22. Means Of Transportation Taxicab Or Other Means To Work By Occupation Of Workers 16 Years And Over In The U.S Estimated From 2015 to 2022. This is part of our Data and Statistics products selection, and you will need a Paid account to download the actual report with accurate data. Downloaded report will contain the actual editable graph with the actual data, an excel table with the actual data, the exact source of the data and the release date. This graph shows the means of transportation to work by taxicab, motorcycle or other means categorized by occupations i.e Management , Service , Sales, Construction and Transportation for workers 16 years and over in the U.S from 2015 to 2017 and forecasts for 2018 to 2022 . It covers topic Means of Transportation Taxicab to work by Occupation for region USA and is for date range 2015 to 22. Download it immediately and use it for your business.
-
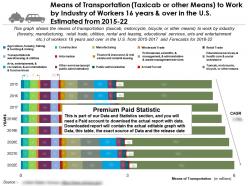 Mode of transport to work by industry taxicab or other means 16 years in us 2015-22
Presenting this set of slides with name - Mode Of Transport To Work By Industry Taxicab Or Other Means 16 Years In US 2015-22. Means Of Transportation Taxicab Or Other Means To Work By Industry Of Workers 16 Years And Over In The U.S Estimated From 2015 to 22. This is part of our Data and Statistics products selection, and you will need a Paid account to download the actual report with accurate data. Downloaded report will contain the actual editable graph with the actual data, an excel table with the actual data, the exact source of the data and the release date. This graph shows the means of transportation taxicab, motorcycle, bicycle, or other means to work by industry forestry, manufacturing, retail trade, utilities, rental and leasing, educational services, arts and entertainment etc. of workers 16 years and over in the U.S from 2015 to 2017 and Forecasts for 2018 to 22. It covers topic Means of transportation by other means to work for region USA and is for date range 2015 to 22. Download it immediately and use it for your business.
-
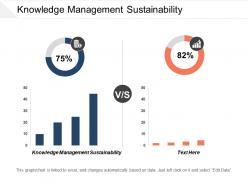 5029772 style essentials 2 financials 2 piece powerpoint presentation diagram infographic slide
Presenting this set of slides with name - Knowledge Management Sustainability Ppt Powerpoint Presentation Gallery Format Ideas Cpb. This is an editable two stages graphic that deals with topics like Knowledge Management Sustainability to help convey your message better graphically. This product is a premium product available for immediate download, and is 100 percent editable in Powerpoint. Download this now and use it in your presentations to impress your audience.
-
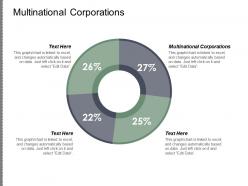 91126842 style essentials 2 financials 4 piece powerpoint presentation diagram infographic slide
Presenting this set of slides with name - Multinational Corporations Ppt Powerpoint Presentation Gallery Grid Cpb. This is an editable four stages graphic that deals with topics like Multinational Corporations to help convey your message better graphically. This product is a premium product available for immediate download, and is 100 percent editable in Powerpoint. Download this now and use it in your presentations to impress your audience.


