All Excel Linked Line Chart Graph Powerpoint Diagram Slide
-
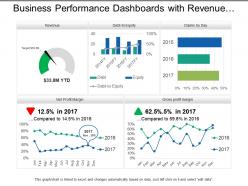 46870140 style essentials 2 dashboard 5 piece powerpoint presentation diagram infographic slide
Presenting, our business performance dashboards with revenue and ratios PPT deck. Pre-designed chart sheet directed PowerPoint Presentation template. Administration of high-resolution images, graphs, and comparison diagrams. Filled with methods and effects to create an impact. Can be quickly converted into JPEG/JPG or PDF formats as per the requirements. Congenial with Google Slides for ease. Project to widescreen without cringing about pixelating, after downloading explore these characteristics.
-
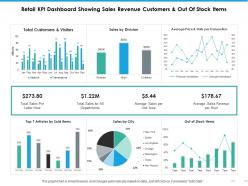 96954373 style essentials 2 financials 6 piece powerpoint presentation diagram infographic slide
Presenting this set of slides with name - Retail Kpi Dashboard Showing Sales Revenue Customers And Out Of Stock Items. This is a six stage process. The stages in this process are Percentage, Product, Management, Marketing, Business.
-
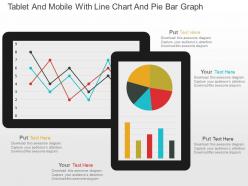 Tablet and mobile with line chart and pie bar graph powerpoint slides
Editable PPT Slide for viewing quarterly track record line chart. Compatible with numerous format options like JPEG, JPG or PDF. Access to inclusion and exclusion of contents as per specific needs of any business. Provides a professional outlook to your PowerPoint presentation. Beneficial for business professionals, students, teachers, business analysts and strategists. Customization of each PowerPoint graphic and text according to your desire and want.
-
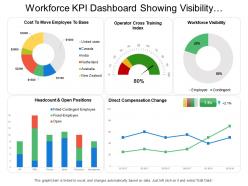 6070909 style essentials 2 financials 5 piece powerpoint presentation diagram infographic slide
Presenting this set of slides with name - Workforce Kpi Dashboard Showing Visibility Headcount And Direct Compensation Change. This is a five stage process. The stages in this process are Staff, Personnel, Workforce.
-
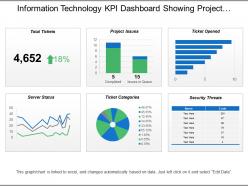 1316560 style essentials 2 financials 6 piece powerpoint presentation diagram infographic slide
Presenting this set of slides with name - Information Technology Kpi Dashboard Showing Project Issues Server Status. This is a six stage process. The stages in this process are Information Technology, It, Iot.
-
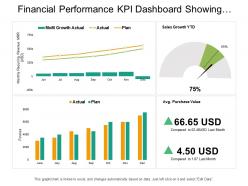 37775282 style concepts 1 growth 3 piece powerpoint presentation diagram infographic slide
Presenting this set of slides with name - Financial Performance Kpi Dashboard Showing Sales Growth Average Purchase Value. This is a three stage process. The stages in this process are Financial Performance, Financial Report, Financial Review.
-
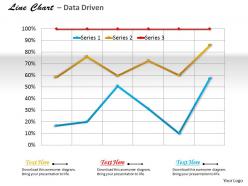 Data driven line chart for business trends powerpoint slides
We are proud to present our data driven line chart for business trends powerpoint slides. Hit A Home Run With Our Data Driven Line Chart For Business Trends Powerpoint Slides Power Point Templates. See Your Ideas Sail Into The Minds Of Your Audience. Score A Slam Dunk With Our Data Driven Line Chart For Business Trends Powerpoint Slides Power Point Templates. Watch Your Audience Hang Onto Your Every Word.
-
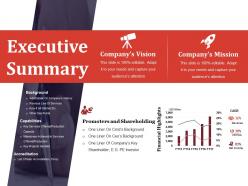 42492338 style concepts 1 growth 5 piece powerpoint presentation diagram infographic slide
Presenting executive summary powerpoint show. This is a executive summary powerpoint show. This is a five stage process. The stages in this process are background, companys vision, companys mission, capabilities.
-
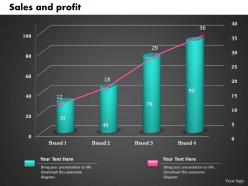 0414 sales and profit column line chart powerpoint graph
Fast and simple to download without unnecessary hassles. Thoroughly editable PowerPoint presentation. Modify the charts at your personal comfort and need. Download and save the presentation in desired format. Compatible with wide variety of online and offline software options. Available in both Standard and Widescreen slide sizes. Add this slide anywhere within your own slides for maximum impact.
-
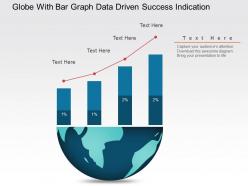 Globe with bar graph data driven success indication powerpoint slides
We are proud to present our globe with bar graph data driven success indication powerpoint slides. Explain the global success indication with this power point template diagram. This PPT diagram contains the graphic of globe with bar graph. Use this PPT diagram for global marketing and business related presentations.
-
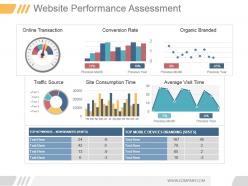 18224459 style essentials 2 financials 3 piece powerpoint presentation diagram infographic slide
Presenting website performance assessment powerpoint ideas. This is a website performance assessment powerpoint ideas. This is a three stage process. The stages in this process are online transaction, conversion rate, organic branded, traffic, source, site consumption time, average visit time, previous month, previous year, top keywords non branded visits, top mobile devices branding visits.
-
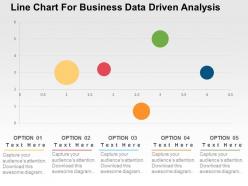 Line chart for business data driven analysis powerpoint slides
Visually stunning presentation infographics. Best quality of Presentation slide graphics. Picture quality don't pixelate when anticipated on wide screen. Effortlessly blend with other software’s such as JPG and PDF. Access to modify the content as color, text and layout can be edited. Adjust the substance at your simplicity. Presentation design compatible with Google slides. Alter the design with by inserting your company name and logo.
-
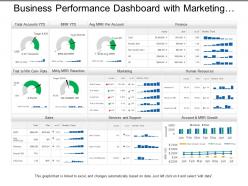 90426821 style essentials 2 dashboard 3 piece powerpoint presentation diagram template slide
Presenting, business performance dashboard with marketing human resource and sales PPT deck. This PPT deck focuses on one of the aspects of business marketing with content broadly researched by our business research team. Quickly editable color combinations, layout, text boxes, and font. Alluring graphs for illustration with relatable images to explain the concept. Transform into PDF and JPG format at ease. Predesigned content is adaptable and can be projected to widescreen for business meetings.
-
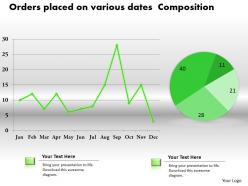 0414 data composition line pie chart powerpoint graph
Smoothly adaptable PowerPoint sample as changes accepted with color, text and shape. PPT guides are well-compatible with Google slides. Presentation clip art can be displayed in standard and widescreen view. Give peculiar touch to the presentation with business symbol, name and image. Alike designs downloadable with different nodes and stages. Effortless to download and change into other format such as JPEG and PDF.
-
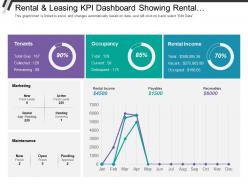 63031800 style essentials 2 financials 3 piece powerpoint presentation diagram infographic slide
As this PPT presentation is fully editable you change the size, orientation and color of the various graphical illustrations used in the pre-designed slides. You can edit the font size, font color and even the font style of the text used here. After you download the slideshow you can view it in standard size display ratio of 4:3 or widescreen display ratio of 16:9 conveniently. Any changes that you need to make can be made following instructions given in the sample slides.
-
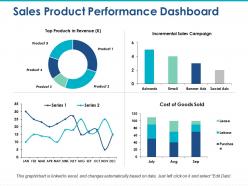 22156387 style division donut 4 piece powerpoint presentation diagram infographic slide
Providing sales product performance dashboard incremental sales campaign presentation template with editing preference as images, icons, colors, text and layout can be edit as required. PowerPoint design can be downloaded and save into JPG and PDF format. High resolution ensures no pixel break. PPT diagram downloadable in standard and widescreen view. Fully adjustable slide as works well with Google slides. Easy to adjust and present when required. Quick to share message effectively.
-
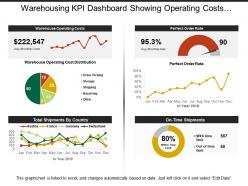 38407203 style essentials 2 financials 6 piece powerpoint presentation diagram infographic slide
The main advantage of this highly versatile PPT design is that it’s completely editable; you can include your business logo, trademarks to personalize the design. Also, you can include business related custom content over text place holders. Design can be opened and edited with Google Slides and MS PowerPoint software. You can download this PowerPoint design into JPEG and PDF formats.
-
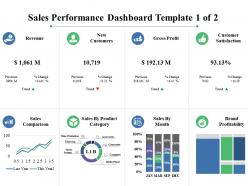 56744903 style division donut 4 piece powerpoint presentation diagram infographic slide
Providing sales performance dashboard revenue new customers PowerPoint template. PPT graphic can be shared in standard and widescreen view. High resolution picture quality ensures no pixel break up even when shared with large set of audience. Presentation slide is adaptable with Google slides. Magnificent to share business communication effectively. PPT slide is available with different nodes and stages. PowerPoint design can be edited as needed and change into JPG and PDF format.
-
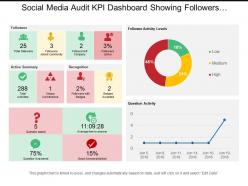 90203367 style essentials 2 financials 3 piece powerpoint presentation diagram infographic slide
This PPT template is very useful for your business PowerPoint presentation. It is fully editable and has editable features like editable font, font size, font color, etc. There are many shapes to choose from like squares, triangles, circles, rectangles, pentagon and many more shapes in order to edit this presentation in PowerPoint. All the images in this PPT are 100% editable. The excel-linked charts in this PPT template can also be edited with ease. It can be viewed and saved in JPG or PDF format. It is fully compatible with Google slides as well.
-
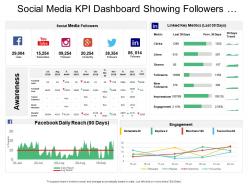 54631728 style essentials 2 financials 5 piece powerpoint presentation diagram infographic slide
SlideTeam presents the Social media KPI dashboard showing followers Facebook daily reach This slideshow is modifiable according to your needs as you can make all the required changes to it whenever you feel like. You can edit the font size and font style. These slides are fully compatible with Google Slides. You can view the presentation on both 16:9 widescreen side as well as the 4:3 standard screen size. You can save them in either JPG or PDF format.
-
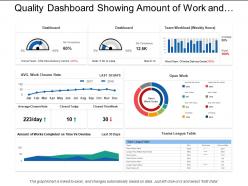 51364766 style essentials 2 financials 3 piece powerpoint presentation diagram infographic slide
SlideTeam presents to you its quality dashboard showing amount of work and the percentage charts.You can also alter the font size, font color and font style of the text so used in the slides. The business template can be saved in format of PDF or JPG as per your requirements. So download this slideshow and make most of it.
-
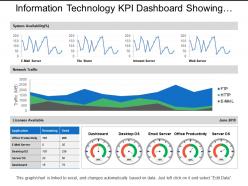 71238953 style essentials 2 financials 4 piece powerpoint presentation diagram infographic slide
Presenting information technology KPI dashboard showing network traffic system PowerPoint template. Choice to view PowerPoint design in standard and widescreen view. Fully editable Presentation dashboards that can be edited as needed. Easy to download and insert in the ongoing presentation. Convertible into Jpeg and Pdf document. Suitable for managers, leaders, sales and marketing people, analysts, etc. Slides are designed using latest management tools and techniques. The high-resolution view is altogether an experience with a brilliant impact.
-
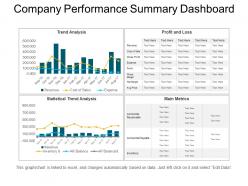 58791496 style essentials 2 financials 4 piece powerpoint presentation diagram infographic slide
Presenting company performance summary dashboard PPT design. They are 100% expertly crafted Presentation graphics. They are quite compatible with all software’s and Google Slides. They have a feature to redesign all the available shapes, patterns, and matters etc. They have an authentic and relevant PPT images with limber data options and can easily add company name or logo.
-
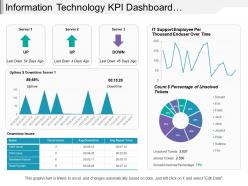 4141153 style essentials 2 financials 4 piece powerpoint presentation diagram infographic slide
Presenting this set of slides with name - Information Technology Kpi Dashboard Showing Downtime Issues Unsolved Tickets. This is a four stage process. The stages in this process are Information Technology, It, Iot.
-
 48504620 style essentials 2 financials 4 piece powerpoint presentation diagram infographic slide
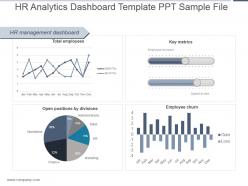
Presenting hr analytics dashboard template ppt sample file. This is a hr analytics dashboard template ppt sample file. This is a four stage process. The stages in this process are hr management dashboard, total employees, key metrics, employee turnover, speed to hire, ftes, jan, feb, mar, apr, may, june, july, aug, sep, oct, nov, dec, open positions by divisions, operations, administrations, sales, hr, marketing, finance, gain, loss, employee churn.
-
 8846920 style concepts 1 growth 2 piece powerpoint presentation diagram template slide
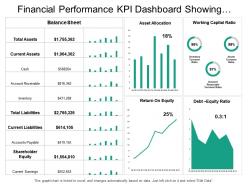
Presenting this set of slides with name - Financial Performance Kpi Dashboard Showing Asset Allocation Balance Sheet. This is a two stage process. The stages in this process are Financial Performance, Financial Report, Financial Review.
-
 84098707 style essentials 2 financials 4 piece powerpoint presentation diagram infographic slide
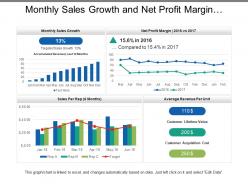
Presenting this set of slides with name - Monthly Sales Growth And Net Profit Margin Dashboard. This is a four stage process. The stages in this process are Sales Dashboard, Sales Kpis, Sales Performance.
-
 5010124 style essentials 2 financials 5 piece powerpoint presentation diagram infographic slide
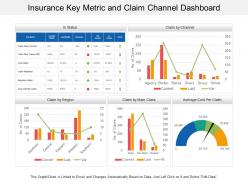
• Easy to customize. • Easy to replace any words, picture or number provided in the template with your own content and use it for presentation. • Freedom to incorporate your own company’s name and logo in the presentation for personalization. • The PPT visuals used are of high resolution. • No issue of image pixilation if projected on wide screen. • Compatibility with numerous format and software options. • Widely used by marketers, businessmen, insurance managers and educators.
-
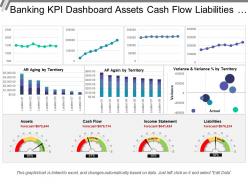 93451775 style essentials 2 financials 3 piece powerpoint presentation diagram template slide
Presenting this set of slides with name - Banking Kpi Dashboard Assets Cash Flow Liabilities Income Statement. This is a three stage process. The stages in this process are Banking, Finance, Money.
-
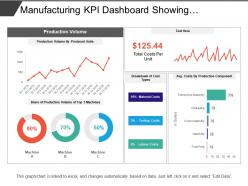 Manufacturing kpi dashboard showing production volume and cost breakdown
Presenting this set of slides with name - Manufacturing Kpi Dashboard Showing Production Volume And Cost Breakdown. This is a four stage process. The stages in this process are Manufacturing, Production, Manufacture.
-
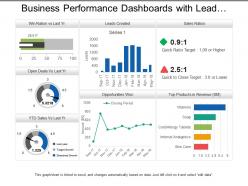 10067338 style essentials 2 dashboard 3 piece powerpoint presentation diagram infographic slide
Presenting, business performance dashboards with lead creation and sales ratios for cost efficiency and performance indication PPT presentation. Bright and informative PowerPoint presentation slides. Gives regulations to achieve business success and targets. Produces error-free execution. Acts as a model for planning future assignments for marketing capabilities. Fully editable by any user at any point in time. Performs a clarity of marketing and presentation objectives without creating any confusions and misconceptions. Simple to be projected to widescreen without degradation in quality.
-
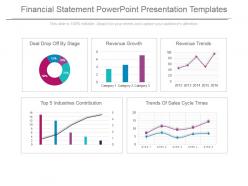 98827662 style essentials 2 financials 5 piece powerpoint presentation diagram infographic slide
Stunning financial statement PowerPoint design. Fit to be used with Google slides. Replace the images, text and the content in the slide design. Change the size, style and orientation of the slides. Use your company’s name or brand name to make it your own presentation template. Beneficial for managers, professors, marketers, etc. Possess great quality for better understanding and error-free performance. Flexible option for conversion in PDF or JPG formats. Available in Widescreen format also. Useful for making business plan and strategies.
-
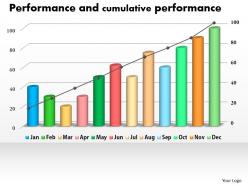 0414 column line chart for cumulative performance powerpoint graph
Incredible quality Presentation visual design with better display. Easy to include personalized content corporate logo or emblem. Contents of slide background are 100% editable to the extent. Multiple options like JPG and PDF for saving the presentation visual. PPT background downloadable with different nodes and stages. The PowerPoint illustration presentable in standard and widescreen view. Impeccable use of vectors which can be customized as per your requirement.
-
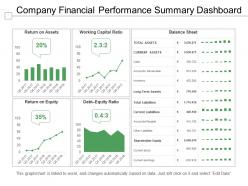 61235127 style concepts 1 growth 4 piece powerpoint presentation diagram infographic slide
Introducing company financial performance summary dashboard PPT slide. Promptly conformable PPT design which saves time with an instant downloading option. Reinstate able PPT image, Restyle able subject matter, designs, context etc. Versant with Google Slides and other applications. Perfectly standardized PowerPoint template quite handy for the trade specialists from diverse areas. Easily convertible into different file arrangements such as PDF or JPG.
-
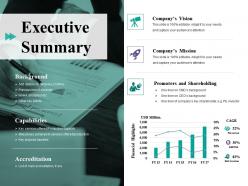 68010950 style concepts 1 growth 5 piece powerpoint presentation diagram infographic slide
Presenting this set of slides with name - Executive Summary Ppt File Elements. This is a five stage process. The stages in this process are Company Vision, Promoters And Shareholding, Background, Capabilities, Accreditation.
-
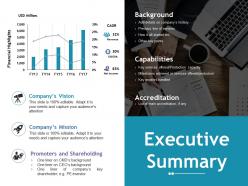 54855013 style concepts 1 growth 5 piece powerpoint presentation diagram infographic slide
Presenting this set of slides with name - Executive Summary Ppt File Example Topics. This is a five stage process. The stages in this process are Company Vision, Promoters And Shareholding, Background, Capabilities, Accreditation.
-
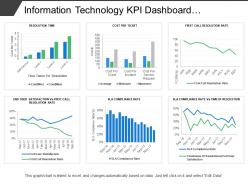 91540265 style essentials 2 financials 6 piece powerpoint presentation diagram infographic slide
Presenting this set of slides with name - Information Technology Kpi Dashboard Showing Cost Per Ticket Sla Compliance Rate. This is a six stage process. The stages in this process are Information Technology, It, Iot.
-
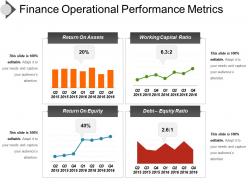 10606351 style essentials 2 financials 4 piece powerpoint presentation diagram infographic slide
Introducing finance operational performance metrics PPT diagram. Exquisitely coordinated PPT design template beneficial for various business professionals. Easily resizable shapes, patterns, and matters etc. Genuine and admissible PPT Image with pliant data options. Adequately compatible with all operating softwares and all Google Slides. Easily convertible to other file formats such as PDF or JPG. Adequate space available to add headings and subheadings. Unaffected high resolution PPT graphic when projected on huge screen.
-
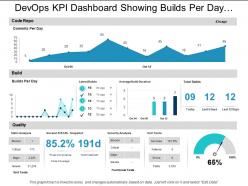 Devops kpi dashboard showing builds per day and code repo
Presenting this set of slides with name - Devops Kpi Dashboard Showing Builds Per Day And Code Repo. This is a three stage process. The stages in this process are Development And Operations, Devops.
-
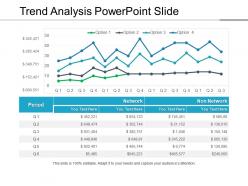 82729957 style essentials 2 financials 4 piece powerpoint presentation diagram infographic slide
Presenting trend analysis PowerPoint template. Access to edit the content, style, size and orientation of the PPT slides. Extremely spacious to cover all the aspects of the company profile. High resolution images do not pixelate when projected on wide screen. Personalize the PPT with your company name and logo. Modify the presentation elements as per the need of an hour. Compatible with numerous software and format options. Used by entrepreneurs, marketers, managerial department, stakeholders and students. Self-explanatory and intellectual slide charts.
-
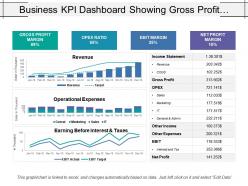 6687541 style essentials 2 financials 3 piece powerpoint presentation diagram infographic slide
Presenting this set of slides with name - Business Kpi Dashboard Showing Gross Profit Margin Opex Ratio And Ebit Margin. This is a three stage process. The stages in this process are Business Dashboard, Business Kpi, Business Performance.
-
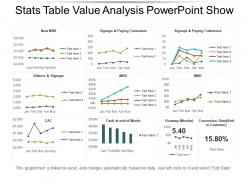 45829420 style essentials 2 financials 9 piece powerpoint presentation diagram infographic slide
Presenting stats table value analysis PowerPoint show. This layout offers you plenty of space to put in titles and sub titles. High resolution-based layout, does not change the image even after resizing. This presentation icon is fully compatible with Google slides. Quick downloading speed and simple editing options in color text and fonts.PPT icons can easily be changed into JPEG and PDF applications. This diagram has been designed for entrepreneurs, corporate and business managers. Easy to use, edit and you can design attractive slides within few minutes.
-
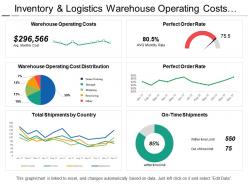 19714613 style essentials 2 financials 6 piece powerpoint presentation diagram infographic slide
Presenting inventory and logistics warehouse operating costs dashboard PPT slideshow. Editable charts, visuals, colors and text. Presentable and easy to comprehend info graphic format. The presentation template can be downloaded and saved in any desired format. Privilege of insertion of logo and trademarks for more personalization. Adaptable to wide screen view without the problem of pixilation. Can be used with Google slides. Easy to edit and customize as per your needs. Beneficial for industry professionals, managers, executives, researchers, sales people, etc.
-
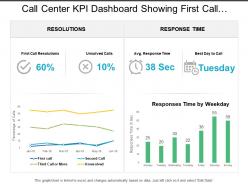 26915225 style essentials 2 financials 2 piece powerpoint presentation diagram infographic slide
Presenting call center KPI dashboard showing first call resolution response time. This deck offers you plenty of space to put in titles and sub titles. This template is Excel linked just right click to input your information. High resolution-based layout, does not change the image even after resizing. This presentation icon is fully compatible with Google slides. Quick downloading speed and simple editing options in color text and fonts.PPT icons can easily be changed into JPEG and PDF applications.
-
 97152031 style essentials 2 financials 3 piece powerpoint presentation diagram infographic slide
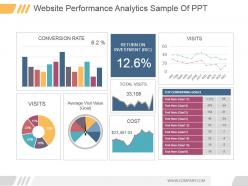
Presenting website performance analytics sample of ppt. This is a website performance analytics sample of ppt. This is a three stage process. The stages in this process are conversion rate, visits, average visit value goal, return on investment ric, total visits, cost, visits, top converting goals, jan, feb, mar, apr, may, jun, jul, aug, sep, oct, nov, dec, goal.
-
 Data driven line chart business graph powerpoint slides
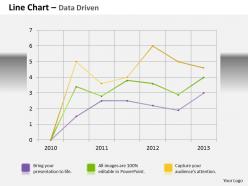
We are proud to present our data driven line chart business graph powerpoint slides. Throw The Gauntlet With Our Data Driven Line Chart Business Graph Powerpoint Slides Power Point Templates. They Are Created To Take Up Any Challenge. Hit The Nail On The Head With Our Data Driven Line Chart Business Graph Powerpoint Slides Power Point Templates. Embed Your Ideas In The Minds Of Your Audience.
-
 46927926 style division non-circular 5 piece powerpoint presentation diagram infographic slide
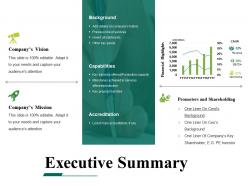
Presenting executive summary powerpoint templates microsoft. This is a executive summary powerpoint templates microsoft. This is a four stage process. The stages in this process are accreditation, capabilities, background, promoters and shareholding.
-
 0414 pareto variation with column line chart powerpoint graph
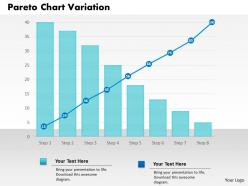
Pixel-friendly images and graphics in the icons. No effect on picture quality when used on a wide screen display. Attune well with the major online and offline softwares. Allow instant customization of the slide icons and the graphics. Provided instructions to customize the content and the slide icons. 100% editable slide icons. Useful for the business entrepreneurs and the marketing individuals.
-
 80531286 style essentials 2 financials 2 piece powerpoint presentation diagram infographic slide
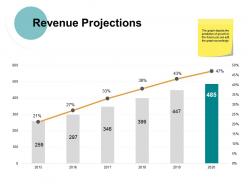
Presenting this set of slides with name - Revenue Projections Ppt Powerpoint Presentation File Designs Download. This is a two stage process. The stages in this process are Finance, Management, Strategy, Business, Marketing.
-
 38768209 style variety 1 silhouettes 3 piece powerpoint presentation diagram infographic slide
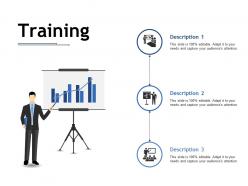
Presenting this set of slides with name - Training Ppt Infographics Example File. This is a three stage process. The stages in this process are Description, Training, Task.
-
 53868423 style essentials 2 financials 3 piece powerpoint presentation diagram infographic slide
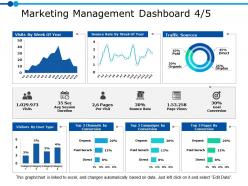
Presenting this set of slides with name - Marketing Management Dashboard 4 5 Ppt Powerpoint Presentation Gallery Example. This is a three stage process. The stages in this process are Business, Management, Strategy, Analysis, Marketing.
-
 89540797 style essentials 2 financials 3 piece powerpoint presentation diagram infographic slide
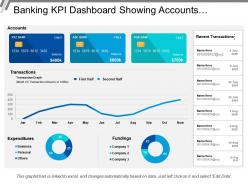
Presenting this set of slides with name - Banking Kpi Dashboard Showing Accounts Expenditures Fundings. This is a three stage process. The stages in this process are Banking, Finance, Money.
-
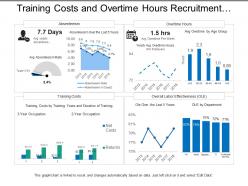 90454204 style essentials 2 financials 4 piece powerpoint presentation diagram infographic slide
Presenting this set of slides with name - Training Costs And Overtime Hours Recruitment Dashboard. This is a four stage process. The stages in this process are Staffing Plan, Recruitment, Staff Management.
-
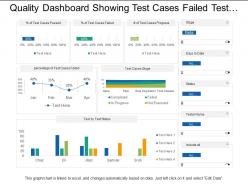 9481681 style essentials 2 financials 3 piece powerpoint presentation diagram infographic slide
SlideTeam feels immense pleasure in presenting to you its quality dashboard showing test cases failed test status and in progress. Following simple instructions given in the sample template you can easily alter the given set of predesigned slides. You can view the PPT template in standard size display ratio of 4:3 or widescreen display ratio of 16:9. The business slides are very easy to use and operate as they are compatible with Google Slides and can be similarly saved in format of PDF or JPG.
-
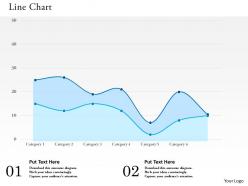 0514 use line chart for business powerpoint slides
Slide runs quite smoothly on all software. Use slides in matter of moments. Insert company logo, name or trademark with no issues. Zero pixilation when slide is viewed on widescreen. Quite Compatible with google slides. Easily display titles and subtitles with no space constraints. High resolution PPT slides. Convert to JPG and PDF formats lucidly and rapidly. Useful for businesses, small and large, technical startups, project management and strategic organizations, educational institutes teaching courses on management, economics, statistics, computer science.
-
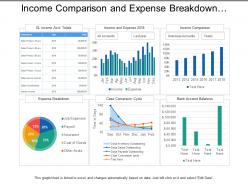 17980133 style division pie 6 piece powerpoint presentation diagram infographic slide
Presenting this set of slides with name - Income Comparison And Expense Breakdown Utilities Dashboard. This is a six stage process. The stages in this process are Utilities, Use, Advantage.
-
 59274613 style essentials 2 financials 3 piece powerpoint presentation diagram infographic slide
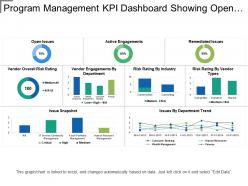
Presenting this set of slides with name - Program Management Kpi Dashboard Showing Open Issues And Risk Rating. This is a three stage process. The stages in this process are Program Development, Human Resource Management, Program Management.
-
 61222110 style essentials 2 financials 4 piece powerpoint presentation diagram template slide
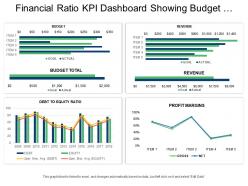
Presenting this set of slides with name - Financial Ratio Kpi Dashboard Snapshot Showing Budget Revenue And Profit Margins. This is a four stage process. The stages in this process are Accounting Ratio, Financial Statement, Financial Ratio.
-
 33223190 style essentials 2 financials 4 piece powerpoint presentation diagram infographic slide
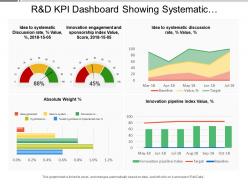
Presenting this set of slides with name - R And D Kpi Dashboard Showing Systematic Discussion Rate Innovation Engagement And Sponsorship Index. This is a four stage process. The stages in this process are R And D, Research And Development, Research And Technological Development.
-
 44987331 style essentials 2 financials 6 piece powerpoint presentation diagram infographic slide
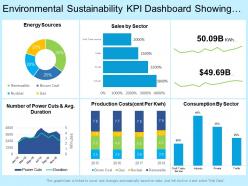
Presenting this set of slides with name - Environmental Sustainability Kpi Dashboard Showing Total Consumption Sales Energy Sources. This is a six stage process. The stages in this process are Environment Sustainability, Environment Continual, Environment Feasibility.


