91519868 style division donut 5 piece powerpoint presentation diagram infographic slide
Etch your ideas in their consciousness with our Donut Pie Chart Ppt Styles Layout Ideas. You will make an abiding contribution.
Etch your ideas in their consciousness with our Donut Pie Chart Ppt Styles Layout Ideas. You will make an abiding contribut..
- Google Slides is a new FREE Presentation software from Google.
- All our content is 100% compatible with Google Slides.
- Just download our designs, and upload them to Google Slides and they will work automatically.
- Amaze your audience with SlideTeam and Google Slides.
-
Want Changes to This PPT Slide? Check out our Presentation Design Services
- WideScreen Aspect ratio is becoming a very popular format. When you download this product, the downloaded ZIP will contain this product in both standard and widescreen format.
-

- Some older products that we have may only be in standard format, but they can easily be converted to widescreen.
- To do this, please open the SlideTeam product in Powerpoint, and go to
- Design ( On the top bar) -> Page Setup -> and select "On-screen Show (16:9)” in the drop down for "Slides Sized for".
- The slide or theme will change to widescreen, and all graphics will adjust automatically. You can similarly convert our content to any other desired screen aspect ratio.
Compatible With Google Slides

Get This In WideScreen
You must be logged in to download this presentation.
PowerPoint presentation slides
Presenting this set of slides with name - Donut Pie Chart Ppt Styles Layout Ideas. This is a five stage process. The stages in this process are Business, Marketing, Chart, Percentage, Process.
Content of this Powerpoint Presentation
Description:
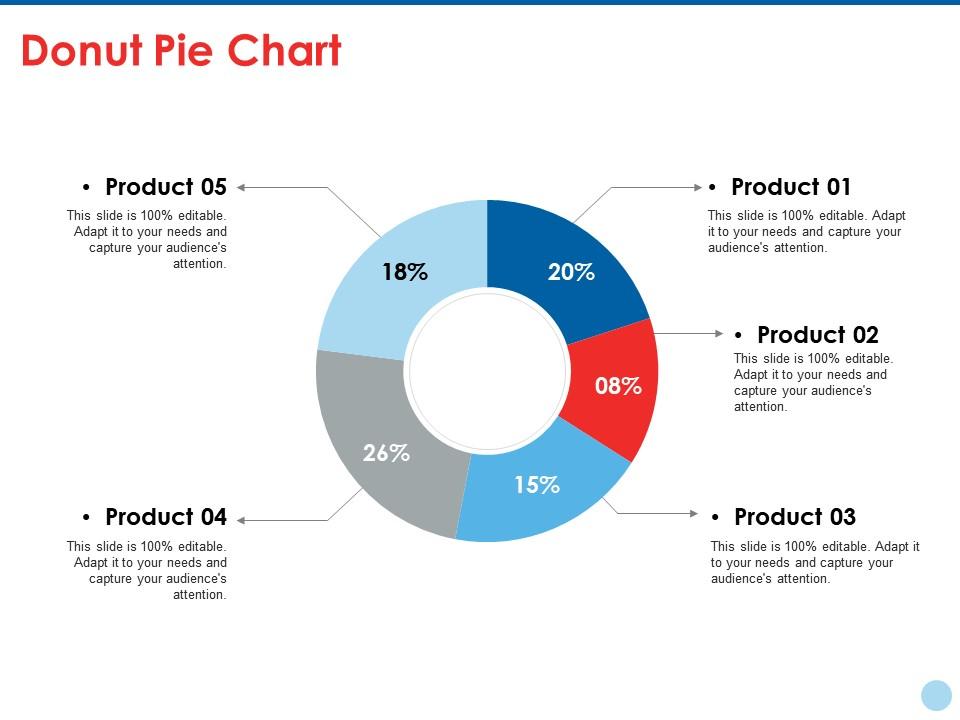
The image depicts a PowerPoint slide featuring a donut pie chart, a circular statistical graphic divided into slices to illustrate numerical proportions.
The chart is divided into five segments, each representing a different product and their corresponding percentages of a whole:
Product 01: 20%
Product 02: 15%
Product 03: 26%
Product 04: 18%
Product 05: 21%
Each segment is color-coded, and placeholders point to each segment where further details can be added. The text on the slide indicates that it is fully editable, allowing the user to adapt it to their specific needs and to capture the audience's attention.
Use Cases:
This slide type can be used across various industries to display data distribution, compare parts to a whole, or present market share. Here are seven industries where this slide could be utilized:
1. Retail:
Use: Showing sales distribution across product categories.
Presenter: Sales Manager.
Audience: Team, stakeholders.
2. Financial Services:
Use: Illustrating portfolio allocation.
Presenter: Financial Analyst.
Audience: Clients, investors.
3. Education:
Use: Displaying student enrollment by program.
Presenter: Admissions Director.
Audience: Educational board, potential students.
4. Healthcare:
Use: Breakdown of patient demographics.
Presenter: Healthcare Administrator.
Audience: Healthcare providers, management.
5. Technology:
Use: Market share of different software products.
Presenter: Product Manager.
Audience: Investors, internal teams.
6. Food and Beverage:
Use: Comparison of product line sales.
Presenter: Marketing Analyst.
Audience: Marketing team, executives.
7. Automotive:
Use: Distribution of sales by car model.
Presenter: Dealer Principal.
Audience: Sales team, automotive manufacturers.
91519868 style division donut 5 piece powerpoint presentation diagram infographic slide with all 5 slides:
Breakthroughs beckon with our Donut Pie Chart Ppt Styles Layout Ideas. They carry you across all barriers.
-
Helpful product design for delivering presentation.
-
Informative presentations that are easily editable.


