All Division Pie Powerpoint Diagram Slide
-
 92804403 style division pie 5 piece powerpoint presentation diagram infographic slide
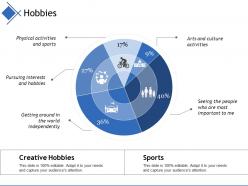
Presenting this set of slides with name - Hobbies Ppt Infographic Template Gallery. This is a five stage process. The stages in this process are Arts And Culture Activities, Pursuing Interests And Hobbies, Physical Activities And Sports, Sports, Creative Hobbies.
-
 10971349 style division pie 5 piece powerpoint presentation diagram infographic slide
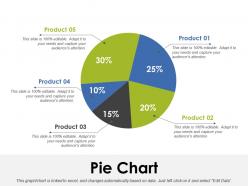
Presenting pie chart PPT inspiration slide portrait PPT slide. The graphical pie chart PowerPoint slide designed professionally by the team of SlideTeam for making a comprehensive PPT of big data. The pie chart graphic template is the data driven template and the user can edit the percentage as the slide gets linked with the Excel spreadsheet. The graphical pie chart slide is customizable in PowerPoint along with that it is compatible with Google Slide so a user can share it with others on the internet. You can make changes in the visual pie chart template such as font size, font type, color and dimensions of icons to make the concepts easier for the audience.
-
 51552000 style division pie 6 piece powerpoint presentation diagram infographic slide
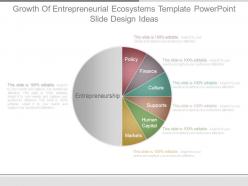
Presenting growth of entrepreneurial ecosystems template powerpoint slide design ideas. This is a growth of entrepreneurial ecosystems template powerpoint slide design ideas. This is a six stage process. The stages in this process are entrepreneurship, policy, finance, culture, supports, human capital, markets.
-
 92797524 style linear single 2 piece powerpoint presentation diagram infographic slide
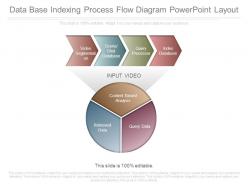
Presenting data base indexing process flow diagram powerpoint layout. This is a data base indexing process flow diagram powerpoint layout. This is a two stage process. The stages in this process are video segmentation, scene shot database, query processor, index database, content based analysis, retrieved data, query data.
-
 74230283 style concepts 1 growth 2 piece powerpoint presentation diagram infographic slide
Presenting organic visits and backlinks powerpoint slide graphics. This is a organic visits and backlinks powerpoint slide graphics. This is a two stage process. The stages in this process are rank, domain authority, backlinks, backlinks.
-
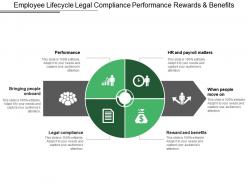 98089252 style division pie 5 piece powerpoint presentation diagram infographic slide
Presenting this set of slides with name - Employee Lifecycle Legal Compliance Performance Rewards And Benefits. This is a five stage process. The stages in this process are Employee Lifecycle, Employee Relationship Management, Work Life Balance.
-
 46109202 style division pie 3 piece powerpoint presentation diagram infographic slide
Presenting Business Development Plan Icon With Pie And Analytics Sign PPT template. Alteration is available for the font type, size, diagram or background color, etc. This presentation is also compatible with Google Slides and can be converted into JPG, PNG, or PDF. The slideshow supports both standard screen(4:3) and widescreen(16:9) aspect ratios.
-
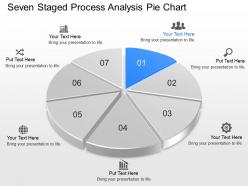 24922231 style division pie 7 piece powerpoint presentation diagram infographic slide
We are proud to present our seven staged process analysis pie chart powerpoint template slide. Seven staged process pie chart has been used to craft this power point template diagram. This PPT diagram contains the concept of result analysis representation. Use this PPT diagram for business and marketing related presentations.
-
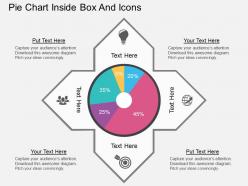 88855004 style division pie 4 piece powerpoint presentation diagram infographic slide
Presenting bj pie chart inside box and icons flat powerpoint design. This Power Point template diagram has been crafted with graphic of peoples on race track . This PPT diagram contains the concept of leadership skills .Use this PPT diagram for business and marketing related presentations.
-
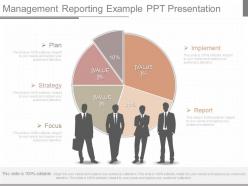 27949657 style division pie 5 piece powerpoint presentation diagram infographic slide
Presenting ppts management reporting example ppt presentation. This is a management reporting example ppt presentation. This is a five stage process. The stages in this process are plan, strategy, focus, implement, report.
-
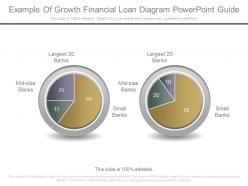 50492635 style division pie 3 piece powerpoint presentation diagram infographic slide
Presenting new example of growth financial loan diagram powerpoint guide. This is a example of growth financial loan diagram powerpoint guide. This is a three stage process. The stages in this process are mid size banks, largest 20 banks, small banks.
-
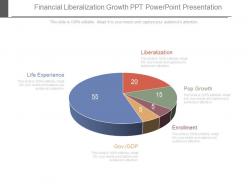 99825458 style division pie 5 piece powerpoint presentation diagram infographic slide
Presenting one financial liberalization growth ppt powerpoint presentation. This is a financial liberalization growth ppt powerpoint presentation. This is a five stage process. The stages in this process are liberalization, pop growth, enrollment, gov gdp, life experience.
-
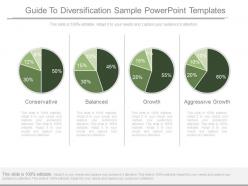 60477125 style division donut 4 piece powerpoint presentation diagram infographic slide
Presenting see guide to diversification sample powerpoint templates. This is a guide to diversification sample powerpoint templates. This is a four stage process. The stages in this process are conservative, balanced, growth, aggressive growth.
-
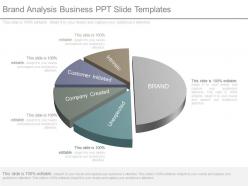 54959027 style division pie 5 piece powerpoint presentation diagram infographic slide
Presenting brand analysis business ppt slide templates. This is a brand analysis business ppt slide templates. This is a five stage process. The stages in this process are brand, intrinsic, customer initiated, company created, unexpected.
-
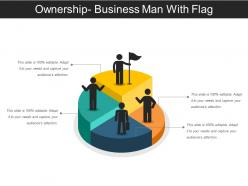 84267717 style division pie 4 piece powerpoint presentation diagram template slide
Presenting Ownership Business Man With Flag PPT Icon. It can be saved in various image and document formats such as JPEG, PNG or PDF(Portable Document Format). This slide can be completely customized according to your needs. The slide is compatible with Google Slides. Moreover, both standard screen(4:3) and widescreen(16:9) aspect ratios are supported. High-quality graphics ensure that distortion does not occur.
-
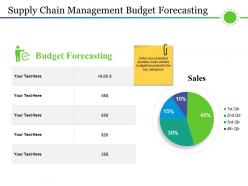 83108993 style division donut 4 piece powerpoint presentation diagram infographic slide
Presenting Supply Chain Management Budget Forecasting PPT Example Professional which is completely editable. This template is compatible with Google Slides, which makes it accessible at once. Alter the colors, fonts, font size, and font types of the template as per the requirements. Can be changed into formats like PDF, JPG, and PNG. Freely access your presentation in both 4:3 and 16:9 aspect ratio.
-
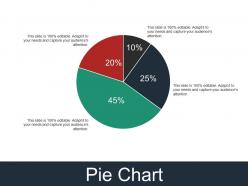 10995519 style division pie 4 piece powerpoint presentation diagram infographic slide
Presenting Pie Chart Presentation Layouts Template 2. This slide is professionally designed and completely adaptable. It can be saved in various image and document formats such as JPEG, PNG or PDF. The slide is compatible with Google Slides. Moreover, both standard and widescreen aspect ratios are supported. The high quality of graphics ensures that there is no deterioration.
-
 76695611 style division pie 8 piece powerpoint presentation diagram infographic slide
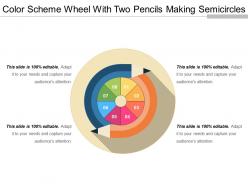
Presenting color scheme wheel with two pencils making semicircles. This is a color scheme wheel with two pencils making semicircles. This is a eight stage process. The stages in this process are color scheme, color wheel, color tool.
-
 41275181 style division pie 3 piece powerpoint presentation diagram infographic slide
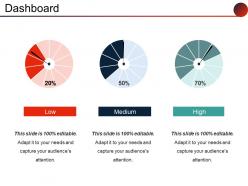
Presenting dashboard powerpoint presentation. This is a dashboard powerpoint presentation. This is a three stage process. The stages in this process are low, medium, high, pie, percentage.
-
 46299696 style division pie 7 piece powerpoint presentation diagram infographic slide
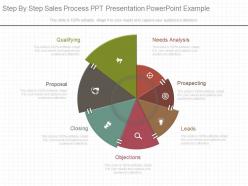
Presenting different step by step sales process ppt presentation powerpoint example. This is a step by step sales process ppt presentation powerpoint example. This is a seven stage process. The stages in this process are qualifying, needs analysis, prospecting, leads, objections, closing, proposal.
-
 61690661 style division pie 6 piece powerpoint presentation diagram infographic slide
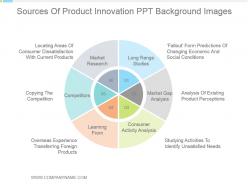
Presenting sources of product innovation ppt background images. This is a sources of product innovation ppt background images. This is a six stage process. The stages in this process are market research, long range studies, market gap analysis, consumer activity analysis, learning from, competitors.
-
 10230248 style division pie 4 piece powerpoint presentation diagram infographic slide
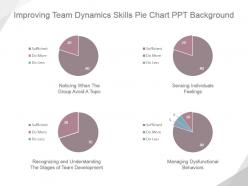
Presenting improving team dynamics skills pie chart ppt background. This is a improving team dynamics skills pie chart ppt background. This is a four stage process. The stages in this process are noticing when the group avoid a topic, sensing individuals feelings, recognizing and understanding the stages of team development, managing dysfunctional behaviors, sufficient do more, do less.
-
 52454829 style division pie 6 piece powerpoint presentation diagram infographic slide
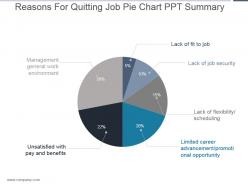
Presenting reasons for quitting job pie chart ppt summary. This is a reasons for quitting job pie chart ppt summary. This is a six stage process. The stages in this process are lack of fit to job, lack of job security, lack of flexibility scheduling, limited career advancement promotional opportunity, management general work environment, unsatisfied with pay and benefits.
-
 26011679 style division pie 3 piece powerpoint presentation diagram infographic slide
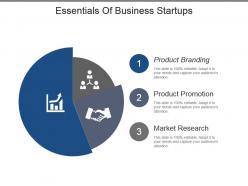
Presenting essentials of business startups powerpoint slide background picture. This is a essentials of business startups powerpoint slide background picture. This is a three stage process. The stages in this process are product branding, product promotion, market research.
-
 90964833 style division pie 7 piece powerpoint presentation diagram infographic slide
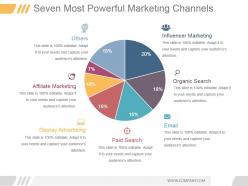
Presenting seven most powerful marketing channels ppt example 2017. This is a seven most powerful marketing channels ppt example 2017. This is a seven stage process. The stages in this process are influencer marketing, organic search, email, paid search, display advertising, affiliate marketing, others.
-
 239700 style division pie 2 piece powerpoint presentation diagram infographic slide
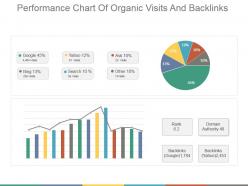
Presenting performance chart of organic visits and backlinks powerpoint shapes. This is a performance chart of organic visits and backlinks powerpoint shapes. This is a two stage process. The stages in this process are pie chart, percentage, finance, backlinks, business.
-
 95292806 style division pie 4 piece powerpoint presentation diagram infographic slide
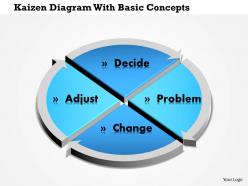
We are proud to present our 0814 business consulting kaizen diagram with basic concepts powerpoint slide template. This diagram is kaizen diagram with basic concepts. This diagram designed to help instruct, construct and present an improvement project. You may create memorable and attractive powerPoint presentations with this professionally designed diagram.
-
 81307498 style division pie 5 piece powerpoint presentation diagram template slide
Presenting about the product pie chart ppt slides. This is a about the product pie chart ppt slides. This is a five stage process. The stages in this process are business, marketing, strategy, management.
-
 61188070 style division pie 4 piece powerpoint presentation diagram infographic slide
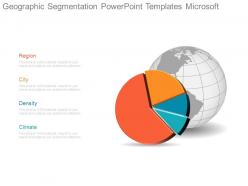
Presenting geographic segmentation powerpoint templates microsoft. This is a geographic segmentation powerpoint templates microsoft. This is a four stage process. The stages in this process are region, city, density, climate.
-
 81390701 style division pie 4 piece powerpoint presentation diagram infographic slide
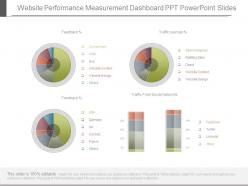
Presenting website performance measurement dashboard ppt powerpoint slides. This is a website performance measurement dashboard ppt powerpoint slides. This is a four stage process. The stages in this process are compliment, wish, bug, website content, website, design, others, usa, germany, canada, france, others, facebook, twitter, linkedin, other, search engines.
-
 60699762 style division pie 3 piece powerpoint presentation diagram infographic slide
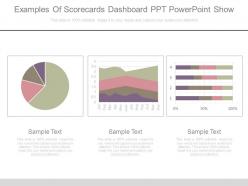
Presenting examples of scorecards dashboard snapshot ppt powerpoint show. This is a examples of scorecards dashboard ppt powerpoint show. This is a three stage process. The stages in this process are sample text, finance, pie.
-
 13469325 style division pie 5 piece powerpoint presentation diagram infographic slide
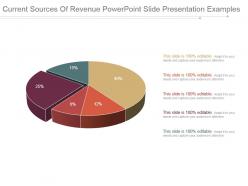
Presenting current sources of revenue powerpoint slide presentation examples. Presenting current sources of revenue powerpoint slide presentation examples. Presenting current sources of revenue powerpoint slide presentation examples. This is a current sources of revenue powerpoint slide presentation examples. This is five stage process. The stages in this process are business, pie, finance, strategy, success, analysis.
-
 14900134 style division pie 7 piece powerpoint presentation diagram infographic slide
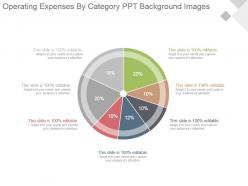
Presenting operating expenses by category ppt background images. This is a operating expenses by category ppt background images. This is a seven stage process. The stages in this process are business, management, marketing, finance, operating.
-
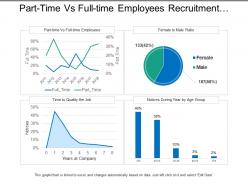 90833591 style division pie 4 piece powerpoint presentation diagram infographic slide
Presenting this set of slides with name - Part Time Vs Full Time Employees Recruitment Dashboard. This is a four stage process. The stages in this process are Staffing Plan, Recruitment, Staff Management.
-
 Pie chart with bar graph icon
Presenting this set of slides with name Pie Chart With Bar Graph Icon. This is a three stage process. The stages in this process are Pie Chart With Bar Graph Icon. This is a completely editable PowerPoint presentation and is available for immediate download. Download now and impress your audience.
-
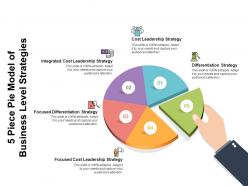 5 piece pie model of business level strategies
Presenting this set of slides with name 5 Piece Pie Model Of Business Level Strategies. This is a five stage process. The stages in this process are Cost Leadership Strategy, Differentiation Strategy, Focused Cost Leadership Strategy, Focused Differentiation Strategy, Integrated Cost Leadership Strategy. This is a completely editable PowerPoint presentation and is available for immediate download. Download now and impress your audience.
-
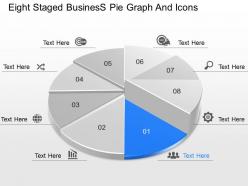 88078640 style division pie 8 piece powerpoint presentation diagram infographic slide
Presenting cp eight staged business pie graph and icons powerpoint template. Eight staged business pie graph and icons has been used to craft this power point template diagram. This PPT diagram contains the concept of result analysis and marketing strategy. Use this PPT diagram for business and marketing related presentations.
-
 23043248 style circular loop 6 piece powerpoint presentation diagram infographic slide
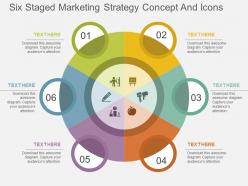
Presenting iq six staged marketing strategy concept and icons flat powerpoint design. Six staged marketing diagram and icons has been used to design this PPT diagram. This PPT diagram contains the concept of marketing strategy representation. Use this PPT diagram for business and marketing related presentations.
-
 67500480 style division pie 4 piece powerpoint presentation diagram infographic slide
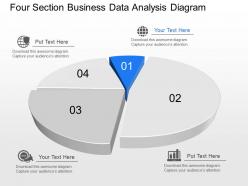
Presenting px four section business data analysis diagram powerpoint template. This Power Point template diagram has been crafted with graphic of four section data diagram. This Power Point template diagram contains the concept of business data analysis representation. Use this PPT diagram for business and finance related presentations.
-
 83265333 style division pie 5 piece powerpoint presentation diagram infographic slide
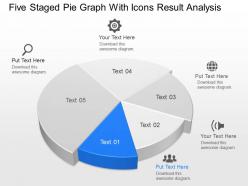
Presenting iw five staged pie graph with icons result analysis powerpoint template. Five staged pie graph and icons has been used to craft this power point template diagram. This PPT diagram contains the concept of result analysis representation. Use this PPT diagram for business and marketing related presentations.
-
 52981158 style division pie 3 piece powerpoint presentation diagram infographic slide
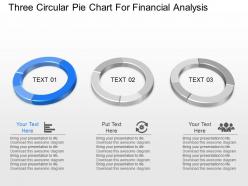
Presenting nj three circular pie chart for financial analysis powerpoint template. This Power Point template diagram has been crafted with graphic of three circular pie charts diagram. This PPT diagram contains the concept of financial analysis representation. Use this PPT diagram for business and finance related presentations.
-
 28965294 style division pie 3 piece powerpoint presentation diagram infographic slide
Presenting market size template2 ppt background images. This is a market size template2 ppt background images. This is a three stage process. The stages in this process are in team of users, in team of revenue from customers, advertisers, event organizers, mentors.
-
 59665629 style division pie 3 piece powerpoint presentation diagram infographic slide
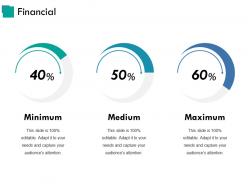
Presenting this set of slides with name - Financial Ppt Sample Download. This is a three stage process. The stages in this process are Minimum, Medium, Maximum, Financial, Percentage.
-
 43271341 style division pie 6 piece powerpoint presentation diagram infographic slide
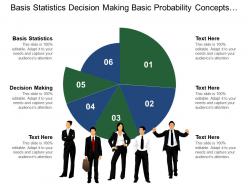
Presenting this set of slides with name - Basis Statistics Decision Making Basic Probability Concepts Enable Support. This is an editable six stages graphic that deals with topics like Basis Statistics, Decision Making, Basic Probability Concepts, Enable Support to help convey your message better graphically. This product is a premium product available for immediate download, and is 100 percent editable in Powerpoint. Download this now and use it in your presentations to impress your audience.
-
 31868151 style concepts 1 growth 4 piece powerpoint presentation diagram infographic slide
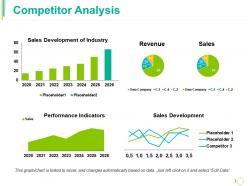
Presenting this set of slides with name - Competitor Analysis Ppt Guide. This is a four stage process. The stages in this process are Development Of Industry, Revenue, Sales, Sales Development, Performance Indicators.
-
 47521778 style division pie 6 piece powerpoint presentation diagram infographic slide
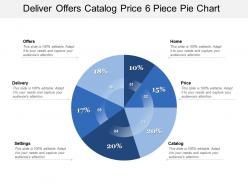
Presenting this set of slides with name - Deliver Offers Catalog Price 6 Piece Pie Chart. This is a six stage process. The stages in this process are 6 Piece Pie Chart, 6 Parts Pie Chart, 6 Segment Pie Chart.
-
 68076696 style division pie 2 piece powerpoint presentation diagram infographic slide
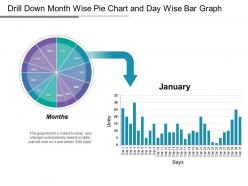
Presenting this set of slides with name - Drill Down Month Wise Pie Chart And Day Wise Bar Graph. This is a two stage process. The stages in this process are Drill Down, Hierarchy, Top Downwards.
-
 Pie chart icon for financial analysis
Presenting this set of slides with name Pie Chart Icon For Financial Analysis. This is a one stage process. The stages in this process are Pie Chart Icon, Employee Analysis, Financial Analysis. This is a completely editable PowerPoint presentation and is available for immediate download. Download now and impress your audience.
-
 Pie chart icon for growth analysis
Presenting this set of slides with name Pie Chart Icon For Growth Analysis. This is a one stage process. The stages in this process are Pie Chart Icon, Employee Analysis, Financial Analysis. This is a completely editable PowerPoint presentation and is available for immediate download. Download now and impress your audience.
-
 Pie chart icon of population distribution
Presenting this set of slides with name Pie Chart Icon Of Population Distribution. This is a one stage process. The stages in this process are Pie Chart Icon, Employee Analysis, Financial Analysis. This is a completely editable PowerPoint presentation and is available for immediate download. Download now and impress your audience.
-
 Pie chart icon of product sample size
Presenting this set of slides with name Pie Chart Icon Of Product Sample Size. This is a one stage process. The stages in this process are Pie Chart Icon, Employee Analysis, Financial Analysis. This is a completely editable PowerPoint presentation and is available for immediate download. Download now and impress your audience.
-
 Pie chart divided into unequal parts with legends
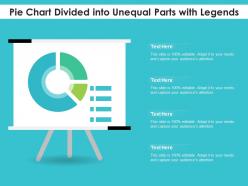
Presenting our set of slides with name Pie Chart Divided Into Unequal Parts With Legends. This exhibits information on one stages of the process. This is an easy-to-edit and innovatively designed PowerPoint template. So download immediately and highlight information on Pie Chart Divided Into Unequal Parts With Legends.
-
 93985210 style division pie 8 piece powerpoint presentation diagram infographic slide
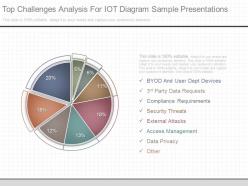
Presenting a top challenges analysis for iot diagram sample presentations. This is a top challenges analysis for iot diagram sample presentations. This is a eight stage process. The stages in this process are byond and user dept devices, 3rd party data requests, compliance requirements, security threats, external attacks, access management, data privacy, other.
-
 61479171 style division pie 3 piece powerpoint presentation diagram infographic slide
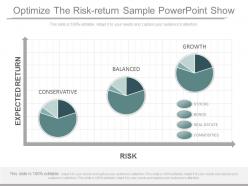
Presenting original optimize the risk return sample powerpoint show. This is a optimize the risk return sample powerpoint show. This is a three stage process. The stages in this process are expected return, risk, growth, balanced, conservative, stocks, bonds, real estate, commodities.
-
 38221669 style division pie 6 piece powerpoint presentation diagram infographic slide
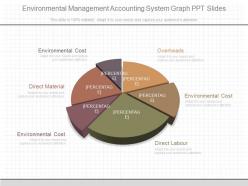
Presenting custom environmental management accounting system graph ppt slides. This is a environmental management accounting system graph ppt slides. This is a six stage process. The stages in this process are environmental cost, direct material, overheads, direct labour.
-
 11768075 style division pie 2 piece powerpoint presentation diagram infographic slide
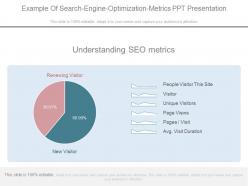
Presenting innovative example of search engine optimization metrics ppt presentation. This is a example of search engine optimization metrics ppt presentation. This is a two stage process. The stages in this process are understanding seo metrics, people visitor this site, visitor, unique visitors, page views, pages visit, avg visit duration, new visitor, renewing visitor.
-
 22240214 style division pie 3 piece powerpoint presentation diagram infographic slide
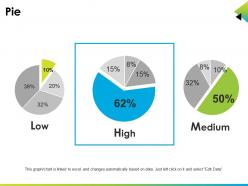
Presenting pie presentation powerpoint templates. This is a pie presentation powerpoint templates. This is a three stage process. The stages in this process are low, high, medium, pie.
-
 3697541 style division pie 5 piece powerpoint presentation diagram infographic slide
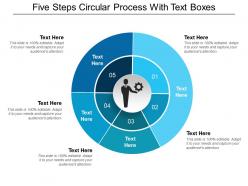
Presenting this set of slides with name - Five Steps Circular Process With Text Boxes. This is a five stage process. The stages in this process are Reorganization, Restructuring, Reoccurring.
-
 76493802 style division pie 4 piece powerpoint presentation diagram infographic slide
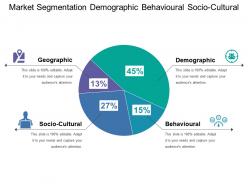
Presenting Market Segmentation Demographic Behavioural Socio-Cultural. Nail last-minute business meets with the help of our 100% custom PowerPoint template. This intuitive PPT slide is engineered intelligently. Even without designing knowledge, you can easily customize font, text, background, orientation, shapes, patterns, and colors. Convert the PowerPoint format and save the presentation as JPG, PDF, and PNG files as and when convenient. View our compatible PPT layout easily using Google Slides. IT also works well with standard and widescreen resolutions.
-
 91355598 style division pie 10 piece powerpoint presentation diagram infographic slide
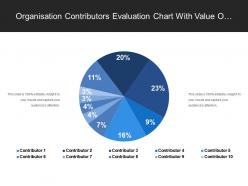
Presenting this set of slides with name - Organisation Contributors Evaluation Chart With Value Of Contribution In Percent. This is a ten stage process. The stages in this process are Contributor, Writer, Reporter.


