Interactive Charts & Graphs PowerPoint Slides
-
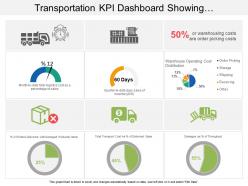 65507121 style essentials 2 dashboard 3 piece powerpoint presentation diagram infographic slide
Presenting transportation KPI dashboard snapshot showing warehouse operating cost distribution PPT slide. Simple data input like company logo, name or trademark. User can edit the data in linked excel sheet and graphs and charts gets customized accordingly. Picture quality of these slides does not change even when project on large screen. Fast downloading speed and formats can be easily changed to JPEG and PDF applications. This template is suitable for marketing, sales persons, business managers and entrepreneurs.
-
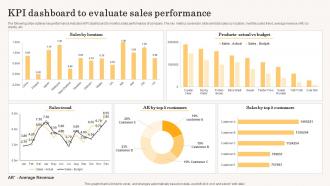 KPI Dashboard To Evaluate Sales Performance Accelerating Business Growth Top Strategy SS V
The following slide outlines key performance indicator KPI dashboard to monitor sales performance of company. The key metrics covered in slide are total sales by location, monthly sales trend, average revenue AR by clients, etc. Present the topic in a bit more detail with this KPI Dashboard To Evaluate Sales Performance Accelerating Business Growth Top Strategy SS V. Use it as a tool for discussion and navigation on Sales Trend, Sales By Location, Actual Vs Budget. This template is free to edit as deemed fit for your organization. Therefore download it now.
-
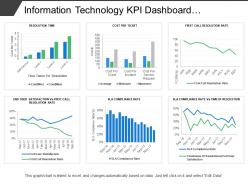 91540265 style essentials 2 financials 6 piece powerpoint presentation diagram infographic slide
Presenting this set of slides with name - Information Technology Kpi Dashboard Showing Cost Per Ticket Sla Compliance Rate. This is a six stage process. The stages in this process are Information Technology, It, Iot.
-
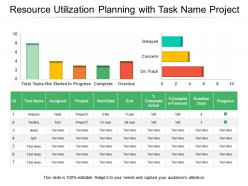 75072055 style essentials 2 financials 3 piece powerpoint presentation diagram infographic slide
Presenting this set of slides with name - Resource Utilization Planning With Task Name Project. This is a three stage process. The stages in this process are Resource Management, Resource Utilization, Resource Allocation.
-
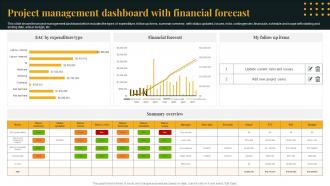 Project Management Dashboard With Financial Forecast
This slide shows the project management dashboard which includes the types of expenditure, follow up items, summary overview, with status updated, issues, risks, contingencies, financials, schedule and scope with starting and ending date, actual budget, etc. Presenting our well structured Project Management Dashboard With Financial Forecast. The topics discussed in this slide are Project Management, Dashboard With Financial Forecast. This is an instantly available PowerPoint presentation that can be edited conveniently. Download it right away and captivate your audience.
-
 Gantt Chart Showing Management Plan For IT Projects
This slide covers Gantt Chart which will be helpful for project leaders to track the task completion on time. It also includes task name such as project definition, design, coding, content build, user experience and presentation. Introducing our Gantt Chart Showing Management Plan For IT Projects that is designed to showcase some of the vital components that will help you create timelines, roadmaps, and project plans. In addition, also communicate your project durations, milestones, tasks, subtasks, dependencies, and other attributes using this well structured Gantt Chart Showing Management Plan For IT Projects template. You can also exhibit preeminence against time by deploying this easily adaptable slide to your business presentation. Our experts have designed this template in such a way that it is sure to impress your audience. Thus, download it and steer your project meetings, meetups, and conferences.
-
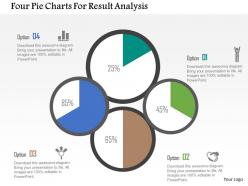 62390824 style division pie 4 piece powerpoint presentation diagram infographic slide
High quality visuals with splendid resolution. 100 percent editable PPT slide templates. Aesthetically designed and professionally proficient. Include or exclude the slide content at your ease and requirement. Compatible with several software options. Harmonious with numerous format options life JPEG, JPG or PDF. Ease of personalization with your company specific name, logo and or trademark.
-
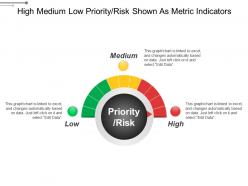 18206121 style essentials 2 dashboard 3 piece powerpoint presentation diagram template slide
Presenting this set of slides with name - High Medium Low Priority Risk Shown As Metric Indicators. This is a three stage process. The stages in this process are High Medium Low, High Moderate Low, Top Medium Low.
-
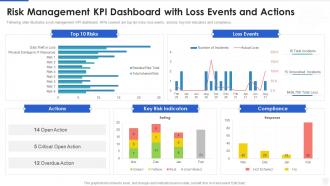 Cybersecurity and digital business risk management risk management kpi dashboard
Following slide illustrates a risk management KPI dashboard. KPIs covered are top ten risks, loss events, actions, key risk indicators and compliance. Deliver an outstanding presentation on the topic using this Cybersecurity And Digital Business Risk Management Risk Management Kpi Dashboard. Dispense information and present a thorough explanation of Risk Management KPI Dashboard With Loss Events And Actions using the slides given. This template can be altered and personalized to fit your needs. It is also available for immediate download. So grab it now.
-
 Talent Sourcing And Recruitment Metrics Dashboard
This slide illustrates graphical representation and other statistics related to talent acquisition. It includes sourcing channels, turnover ratio age-wise, recruitment conduit etc. Presenting our well-structured Talent Sourcing And Recruitment Metrics Dashboard. The topics discussed in this slide are Recruitment, Metrics, Dashboard, Sourcing. This is an instantly available PowerPoint presentation that can be edited conveniently. Download it right away and captivate your audience.
-
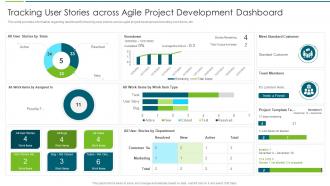 Agile Transformation Approach Playbook Stories Across Agile Project Development Dashboard
This slide provides information regarding dashboard for tracking user stories across agile project development including work items, etc. Present the topic in a bit more detail with this Agile Transformation Approach Playbook Stories Across Agile Project Development Dashboard. Use it as a tool for discussion and navigation on Agile Project, Development, Dashboard . This template is free to edit as deemed fit for your organization. Therefore download it now.
-
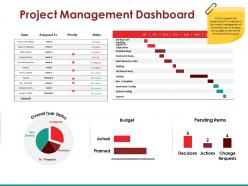 82123075 style essentials 2 financials 4 piece powerpoint presentation diagram infographic slide
Presenting this set of slides with name - Project Management Dashboard Powerpoint Slide Ideas. This is a four stage process. The stages in this process are Overall Task Status, Budget, Pending Items, Decisions.
-
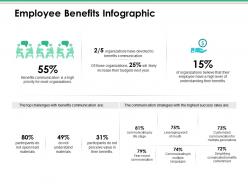 53545004 style essentials 2 financials 2 piece powerpoint presentation diagram infographic slide
Presenting this set of slides with name - Employee Benefits Infographic Ppt Infographic Template Professional. This is a two stage process. The stages in this process are Business, Management, Strategy, Analysis, Communication.
-
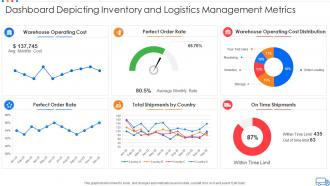 Dashboard depicting inventory and logistics management metrics
Introducing our Dashboard Depicting Inventory And Logistics Management Metrics set of slides. The topics discussed in these slides are Dashboard Depicting Inventory And Logistics Management Metrics. This is an immediately available PowerPoint presentation that can be conveniently customized. Download it and convince your audience.
-
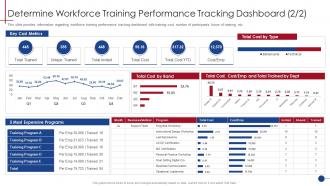 Determine Workforce Training Human Resource Training Playbook
This slide provides information regarding workforce training performance tracking dashboard with training cost, number of participants, hours of training, etc. Present the topic in a bit more detail with this Determine Workforce Training Human Resource Training Playbook. Use it as a tool for discussion and navigation on Determine Workforce Training Performance Tracking Dashboard. This template is free to edit as deemed fit for your organization. Therefore download it now.
-
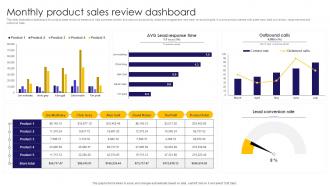 Monthly Product Sales Review Dashboard
This slide illustrates a dashboard for product sales review to measure to help business monitor and improve productivity, employee engagement and meet revenue targets. It covers product names with sales reps, lead conversion, response time and outbound calls. Presenting our well structured Monthly Product Sales Review Dashboard. The topics discussed in this slide are AVG Lead Response, Time, Outbound Calls, Lead Conversion Rate. This is an instantly available PowerPoint presentation that can be edited conveniently. Download it right away and captivate your audience.
-
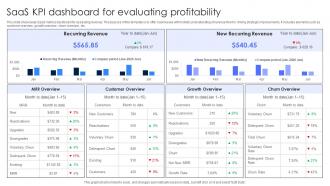 SaaS KPI Dashboard For Evaluating Profitability
This slide showcases SaaS metrics dashboard for assessing revenue. The purpose of this template is to offer businesses with holistic understanding of revenue flow for driving strategic improvements. It includes elements such as customer overview, growth overview, churn overview, etc. Presenting our well structured SaaS KPI Dashboard For Evaluating Profitability. The topics discussed in this slide are Recurring Revenue, New Recurring Revenue, Evaluating Profitability. This is an instantly available PowerPoint presentation that can be edited conveniently. Download it right away and captivate your audience.
-
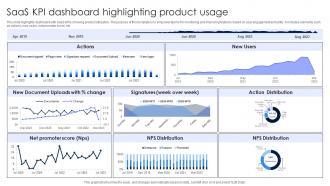 SaaS KPI Dashboard Highlighting Product Usage
This slide highlights dashboard with SaaS KPIs showing product utilization. The purpose of this template is to empower teams for monitoring and improving features based on user engagement and utility. It includes elements such as actions, new users, net promoter score, etc. Introducing our SaaS KPI Dashboard Highlighting Product Usage set of slides. The topics discussed in these slides are New Document Uploads, Net Promoter Score, Product Usage. This is an immediately available PowerPoint presentation that can be conveniently customized. Download it and convince your audience.
-
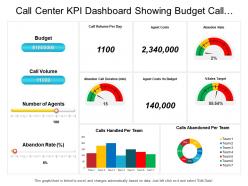 54443813 style essentials 2 financials 4 piece powerpoint presentation diagram infographic slide
Presenting this set of slides with name - Call Center Kpi Dashboard Showing Budget Call Volume Agent Costs Percentage Sales Target. This is a four stage process. The stages in this process are Call Center Agent, Customer Care, Client Support.
-
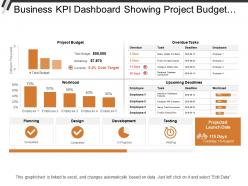 26516622 style essentials 2 financials 2 piece powerpoint presentation diagram infographic slide
Presenting this set of slides with name - Business Kpi Dashboard Showing Project Budget Overdue Tasks And Workload. This is a two stage process. The stages in this process are Business Dashboard, Business Kpi, Business Performance.
-
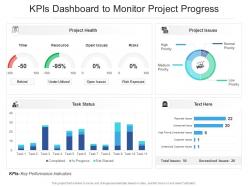 Kpis dashboard to monitor project progress
Introducing our KPIs Dashboard Snapshot To Monitor Project Progress set of slides. The topics discussed in these slides are KPIs Dashboard To Monitor Project Progress. This is an immediately available PowerPoint presentation that can be conveniently customized. Download it and convince your audience.
-
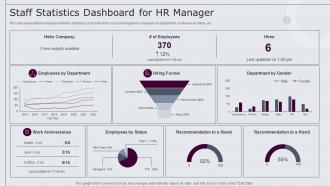 Staff Statistics Dashboard For Hr Manager
This slide represents the employee statistics dashboard. It includes KPIs such as hiring funnel, employees by department, employees by status, etc. Presenting our well structured Staff Statistics Dashboard For Hr Manager. The topics discussed in this slide are Statistics, Dashboard, Department. This is an instantly available PowerPoint presentation that can be edited conveniently. Download it right away and captivate your audience.
-
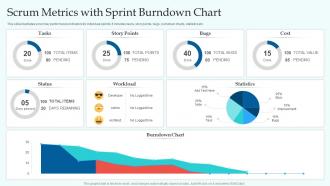 Scrum Metrics With Sprint Burndown Chart
This slide illustrates scrum key performance indicators for individual sprints. It includes tasks, story points, bugs, burndown charts, statistics etc. Presenting our well structured Scrum Metrics With Sprint Burndown Chart. The topics discussed in this slide are Story Points, Statistics, Workload, Burndown Chart. This is an instantly available PowerPoint presentation that can be edited conveniently. Download it right away and captivate your audience.
-
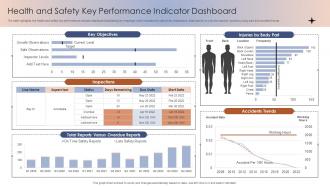 Health And Safety Key Performance Indicator Dashboard
The slide highlights the health and safety key performance indicator dashboard illustrating key headings which includes key objectives, inspections, total reports vs over due reports, injuries by body part and accident trends Introducing our Health And Safety Key Performance Indicator Dashboard set of slides. The topics discussed in these slides are Key Objectives, Inspections, Overdue Reports, Accidents Trends. This is an immediately available PowerPoint presentation that can be conveniently customized. Download it and convince your audience.
-
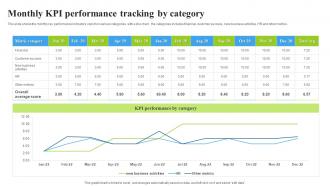 Monthly KPI Performance Tracking By Category
This slide shows the monthly key performance indicators report on various categories with a line chart. the categories includes financial, customer success, new business activities, HR and other metrics. Presenting our well structured Monthly KPI Performance Tracking By Category. The topics discussed in this slide are Performance Category, Tracking Category, Average Score. This is an instantly available PowerPoint presentation that can be edited conveniently. Download it right away and captivate your audience.
-
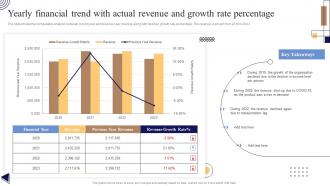 Yearly Financial Trend With Actual Revenue And Growth Rate Percentage
The slide shows the comparative analysis between current year and previous year revenue along with revenue growth rate percentage. The revenue is shown from 2019 to 2023. Introducing our Yearly Financial Trend With Actual Revenue And Growth Rate Percentage set of slides. The topics discussed in these slides are Yearly Financial Trend, Actual Revenue, Growth Rate Percentage. This is an immediately available PowerPoint presentation that can be conveniently customized. Download it and convince your audience.
-
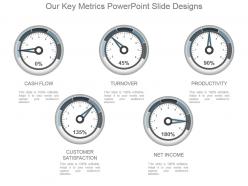 35570286 style essentials 2 dashboard 5 piece powerpoint presentation diagram infographic slide
Presenting our key metrics PowerPoint slide designs. This power point slide offers you plenty of space to put in titles and sub titles. High resolution-based presentation layout does not change the image even after resizing. This presentation icon is fully compatible with Google slides. Quick downloading speed and simple editing options in color text and fonts.PPT icons can easily be changed into JPEG and PDF applications. This diagram has been designed for entrepreneurs, corporate and business managers.
-
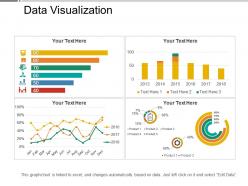 60182454 style essentials 2 financials 4 piece powerpoint presentation diagram template slide
Presenting this Data Visualization PowerPoint slide. This PPT presentation is Google Slides compatible hence it is easily accessible. You can download and save this PowerPoint layout in different formats like PDF, PNG, and JPG. This PPT theme is available in both 4:3 and 16:9 aspect ratios. As this PowerPoint template is 100% editable, you can modify color, font size, font type, and shapes as per your requirements.
-
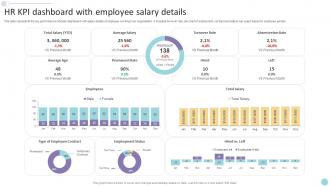 HR KPI Dashboard With Employee Salary Details
This slide represents the key performance indicator dashboard snapshot with salary details of employee working in an organisation. It includes turnover rate, pie chart of employment contract and status, bar graph based on employee gender Introducing our HR KPI Dashboard With Employee Salary Details set of slides. The topics discussed in these slides are HR KPI Dashboard Snapshot Employee Salary Details. This is an immediately available PowerPoint presentation that can be conveniently customized. Download it and convince your audience.
-
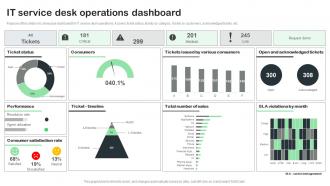 IT Service Desk Operations Dashboard
Purpose of this slide is to showcase dashboard for IT service desk operations. It covers ticket status, tickets by category, tickets by customers, acknowledged tickets, etc. Presenting our well structured IT Service Desk Operations Dashboard. The topics discussed in this slide are Ticket Status, Consumers, Performance, Consumer Satisfaction Rate. This is an instantly available PowerPoint presentation that can be edited conveniently. Download it right away and captivate your audience.
-
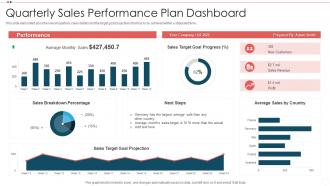 Quarterly Sales Performance Plan Dashboard
This slide elaborated about he overall quarterly sales details and the target goal projections that has to be achieved within a stipulated time. Presenting our well-structured Quarterly Sales Performance Plan Dashboard. The topics discussed in this slide are Sales Target Goal Progress, Sales Breakdown Percentage, Sales Target Goal Projection. This is an instantly available PowerPoint presentation that can be edited conveniently. Download it right away and captivate your audience.
-
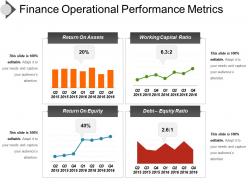 10606351 style essentials 2 financials 4 piece powerpoint presentation diagram infographic slide
Introducing finance operational performance metrics PPT diagram. Exquisitely coordinated PPT design template beneficial for various business professionals. Easily resizable shapes, patterns, and matters etc. Genuine and admissible PPT Image with pliant data options. Adequately compatible with all operating softwares and all Google Slides. Easily convertible to other file formats such as PDF or JPG. Adequate space available to add headings and subheadings. Unaffected high resolution PPT graphic when projected on huge screen.
-
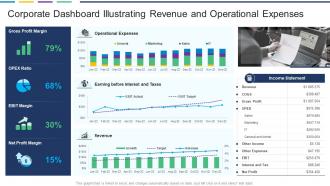 Corporate Dashboard Illustrating Revenue And Operational Expenses
This graph or chart is linked to excel, and changes automatically based on data. Just left click on it and select edit data. Introducing our Corporate Dashboard Illustrating Revenue And Operational Expenses set of slides. The topics discussed in these slides are Gross Profit Margin, PEX Ratio, EBIT Margin, Net Profit Margin. This is an immediately available PowerPoint presentation that can be conveniently customized. Download it and convince your audience.
-
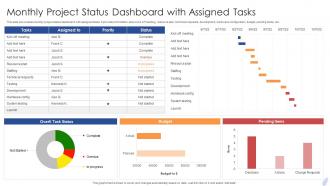 Monthly Project Status Dashboard With Assigned Tasks
This slide showcases monthly project status dashboard with assigned tasks. It provides information about kick off meeting, resource plan, technical requests, development, hardware configuration, budget, pending items, etc. Introducing our Monthly Project Status Dashboard With Assigned Tasks set of slides. The topics discussed in these slides are Monthly Project Status, Dashboard, Assigned Tasks. This is an immediately available PowerPoint presentation that can be conveniently customized. Download it and convince your audience.
-
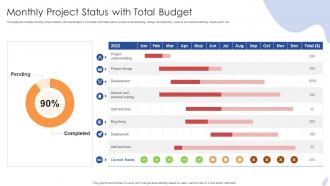 Monthly Project Status With Total Budget
This slide showcases monthly project status with total budget. It provides information about project understanding, design, development, internal and external testing, deployment, etc. Introducing our Monthly Project Status With Total Budget set of slides. The topics discussed in these slides are Monthly Project Status, Total Budget. This is an immediately available PowerPoint presentation that can be conveniently customized. Download it and convince your audience.
-
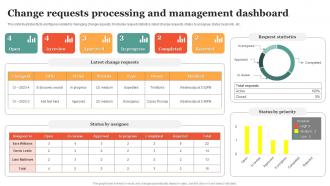 Change Requests Processing And Management Dashboard
This slide illustrates facts and figures related to managing change requests. It includes request statistics, latest change requests, status by assignee, status by priority, etc. Presenting our well structured Change Requests Processing And Management Dashboard. The topics discussed in this slide are Progress, Rejected, Review, Management Dashboard. This is an instantly available PowerPoint presentation that can be edited conveniently. Download it right away and captivate your audience.
-
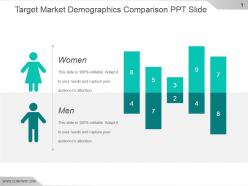 93212149 style essentials 2 compare 2 piece powerpoint presentation diagram infographic slide
Presenting target market demographics comparison ppt slide. This is a target market demographics comparison ppt slide. This is a two stage process. The stages in this process are women, men.
-
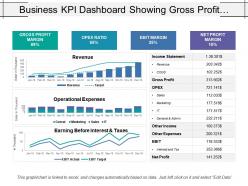 6687541 style essentials 2 financials 3 piece powerpoint presentation diagram infographic slide
Presenting this set of slides with name - Business Kpi Dashboard Showing Gross Profit Margin Opex Ratio And Ebit Margin. This is a three stage process. The stages in this process are Business Dashboard, Business Kpi, Business Performance.
-
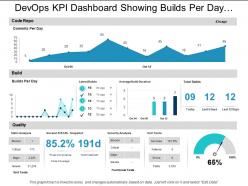 Devops kpi dashboard showing builds per day and code repo
Presenting this set of slides with name - Devops Kpi Dashboard Showing Builds Per Day And Code Repo. This is a three stage process. The stages in this process are Development And Operations, Devops.
-
 Dashboards by function finance profit and loss dashboard
Present the topic in a bit more detail with this Dashboards By Function Finance Profit And Loss Dashboard. Use it as a tool for discussion and navigation on Finance Profit And Loss Dashboard. This template is free to edit as deemed fit for your organization. Therefore download it now.
-
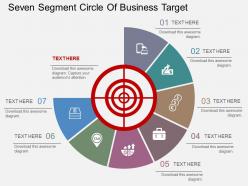 51043732 style circular semi 7 piece powerpoint presentation diagram infographic slide
Rational and resourceful PowerPoint visuals, An impressive tool perfect for Business professionals from diverse Companies, Huge range of unique PPT slides with multiple colored theme options , Quickly changeable colors, texts, fonts, graphics, PPT images, info graphic PPT designs in vector formats, High quality visuals , Exclusive design for better conceptualization, Resizable and editable Presentation graphics.
-
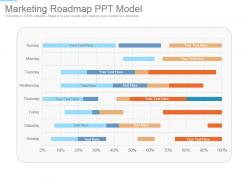 93386201 style essentials 2 compare 8 piece powerpoint presentation diagram infographic slide
Presenting, marketing roadmap PPT model PowerPoint Presentation. This is an appealing plan for data presentation and analysis related PowerPoint presentation. This PPT layout can be practiced by professionals from diverse background to present their ideas in a smart way. This slide is compatible with Google slides and can be saved in JPG/PDF formats, after downloading you can use it in full version and incorporate your company's logo for your best experience.
-
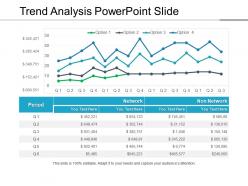 82729957 style essentials 2 financials 4 piece powerpoint presentation diagram infographic slide
Presenting trend analysis PowerPoint template. Access to edit the content, style, size and orientation of the PPT slides. Extremely spacious to cover all the aspects of the company profile. High resolution images do not pixelate when projected on wide screen. Personalize the PPT with your company name and logo. Modify the presentation elements as per the need of an hour. Compatible with numerous software and format options. Used by entrepreneurs, marketers, managerial department, stakeholders and students. Self-explanatory and intellectual slide charts.
-
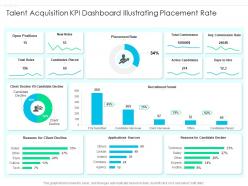 Talent acquisition kpi dashboard illustrating placement rate
Presenting our well structured Talent Acquisition KPI Dashboard Illustrating Placement Rate. The topics discussed in this slide are Funnel, Sources, Commission. This is an instantly available PowerPoint presentation that can be edited conveniently. Download it right away and captivate your audience.
-
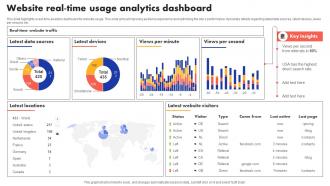 Website Real Time Usage Analytics Dashboard
This slide highlights a real-time analytics dashboard for website usage. This slide aims at improving audience experience and optimizing the sites performance. It provides details regarding latest data sources, latest devices, views per second, etc. Introducing our Website Real Time Usage Analytics Dashboard set of slides. The topics discussed in these slides are Latest Data Sources, Views Per Minute. This is an immediately available PowerPoint presentation that can be conveniently customized. Download it and convince your audience.
-
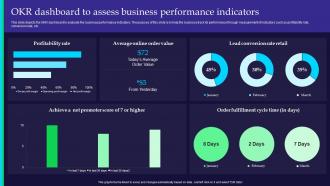 OKR Dashboard To Assess Business Performance Indicators
This slide depicts the OKR dashboard to evaluate the business performance indicators. The purpose of this slide is to help the business track its performance through measurement of indicators such as profitability rate, conversion rate, etc. Introducing our OKR Dashboard To Assess Business Performance Indicators set of slides. The topics discussed in these slides are Profitability Rate, Average Online, Conversion Rate Retail This is an immediately available PowerPoint presentation that can be conveniently customized. Download it and convince your audience.
-
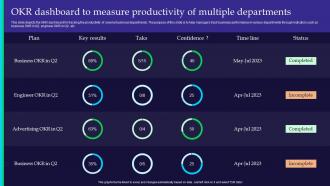 OKR Dashboard To Measure Productivity Of Multiple Departments
This slide depicts the OKR dashboard for tracking the productivity of several business departments. The purpose of this slide is to help managers track business performance in various departments through indicators such as business OKR in Q2, engineer OKR in Q2, etc. Introducing our OKR Dashboard To Measure Productivity Of Multiple Departments set of slides. The topics discussed in these slides are Business, Engineer, Advertising This is an immediately available PowerPoint presentation that can be conveniently customized. Download it and convince your audience.
-
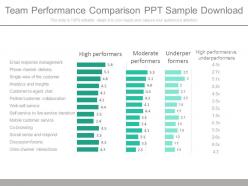 17875386 style layered vertical 3 piece powerpoint presentation diagram infographic slide
Presenting team performance comparison PPT slide. Access to download and save in the JPG or PDF format. Convenient to be used on a wide screen view. No effect on the picture quality whatever be the size of your screen. Useful for industry professionals, managers, executives, researchers, sales people, etc. Edit the size, style and orientation of the visuals and shapes. Follow given instructions to modify the slide template. The slide offers easy and effortless modification. Compatible with Google slides also.
-
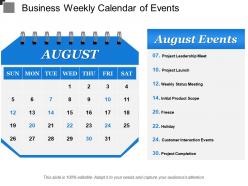 37178932 style variety 2 calendar 1 piece powerpoint presentation diagram infographic slide
Presenting this set of slides with name - Business Weekly Calendar Of Events. This is a one stage process. The stages in this process are Burn Down Chart, Agile Software Development Chart, Run Chart.
-
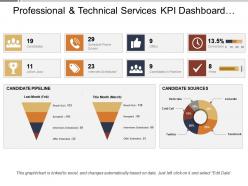 65650500 style essentials 2 financials 4 piece powerpoint presentation diagram infographic slide
Presenting this set of slides with name - Professional And Technical Services Kpi Dashboard Showing Recruitment And Hiring. This is a four stage process. The stages in this process are Professional And Technical Services, Services Management, Technical Management.
-
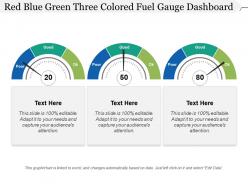 37162780 style essentials 2 dashboard 3 piece powerpoint presentation diagram infographic slide
Presenting this set of slides with name - Red Blue Green Three Colored Fuel Gauge Dashboard. This is a three stage process. The stages in this process are Fuel Gauge, Gas Gauge, Fuel Containers.
-
 Audit dashboard with different tabs
Presenting this set of slides with name Audit Dashboard Snapshot With Different Tabs. The topics discussed in these slide is Audit Dashboard With Different Tabs. This is a completely editable PowerPoint presentation and is available for immediate download. Download now and impress your audience.
-
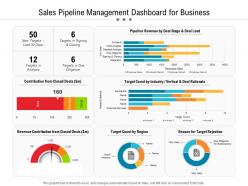 Sales pipeline management dashboard for business
Presenting this set of slides with name Sales Pipeline Management Dashboard For Business. The topics discussed in these slides are Revenue, Target, Diligence. This is a completely editable PowerPoint presentation and is available for immediate download. Download now and impress your audience.
-
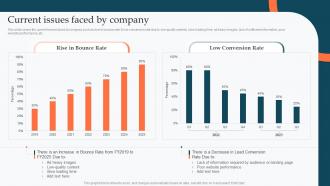 Current Issues Faced By Company Enhance Product Sales Using Different Branding Strategies
This slide covers the current issues faced by company such as rise in bounce rate and low conversion rate due to low quality content, slow loading time, ad heavy images, lack of sufficient information, poor website performance, etc. Present the topic in a bit more detail with this Current Issues Faced By Company Enhance Product Sales Using Different Branding Strategies. Use it as a tool for discussion and navigation on Rise Bounce Rate, Low Conversion Rate. This template is free to edit as deemed fit for your organization. Therefore download it now.
-
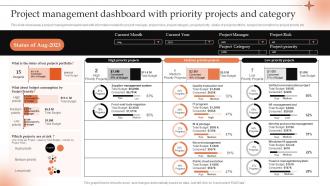 Conducting Project Viability Study To Ensure Profitability Project Management Dashboard
This slide showcases a project management dashboard with information related to project manager, project risks, project category, project priority, status of project portfolio, budget consumption by project priority etc. Present the topic in a bit more detail with this Conducting Project Viability Study To Ensure Profitability Project Management Dashboard. Use it as a tool for discussion and navigation on Project Manager, Project Priority, Project Category. This template is free to edit as deemed fit for your organization. Therefore download it now.
-
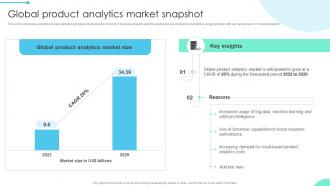 Global Product Enhancing Business Insights Implementing Product Data Analytics SS V
This slide showcase a graphical representation global product analytics market. It includes present and forecasted values of advanced analytics usage globally with key takeaways on market situation. Present the topic in a bit more detail with this Global Product Enhancing Business Insights Implementing Product Data Analytics SS V. Use it as a tool for discussion and navigation on Key Insights, Global Product Analytics, Reasons. This template is free to edit as deemed fit for your organization. Therefore download it now.
-
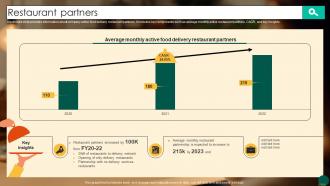 Restaurant Partners Food Ordering Website Company Profile CP SS V
Mentioned slide provides information about company active food delivery restaurant partners. It includes key components such as average monthly active restaurant partners, CAGR, and key insights. Present the topic in a bit more detail with this Restaurant Partners Food Ordering Website Company Profile CP SS V Use it as a tool for discussion and navigation on Restaurant Partners This template is free to edit as deemed fit for your organization. Therefore download it now.
-
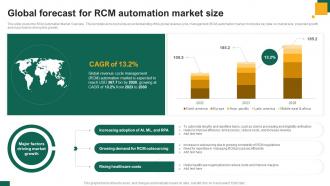 Global Forecast For RCM Automation Market Size
This slide covers the RCM Automation Market Overview. This template aims to provide an understanding of the global revenue cycle management RCM automation market. It includes key data on market size, projected growth and major factors driving this growth. Introducing our Global Forecast For RCM Automation Market Size set of slides. The topics discussed in these slides are Increasing Adoption, Growing Demand, Rising Healthcare Costs. This is an immediately available PowerPoint presentation that can be conveniently customized. Download it and convince your audience.
-
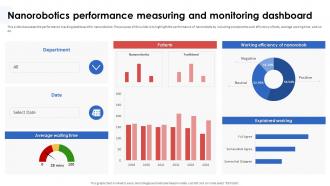 Nanorobotics In Healthcare And Medicine Nanorobotics Performance Measuring And Monitoring
This slide showcases the performance tracking dashboard for nanorobotics. The purpose of this slide is to highlight the performance of nanorobots by including components such efficiency of bots, average waiting time, and so on. Present the topic in a bit more detail with this Nanorobotics In Healthcare And Medicine Nanorobotics Performance Measuring And Monitoring. Use it as a tool for discussion and navigation on Nanorobotics Performance Measuring, Monitoring Dashboard, Performance Tracking, Dashboard For Nanorobotics. This template is free to edit as deemed fit for your organization. Therefore download it now.
-
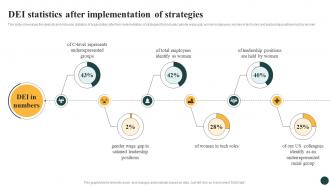 DEI Statistics Implementing Strategies To Enhance And Promote Workplace DTE SS
This slide showcases the diversity and inclusion statistics of organization after the implementation of strategies that includes gender wage gap, women employees, women in tech roles and leadership positions held by women. Deliver an outstanding presentation on the topic using this DEI Statistics Implementing Strategies To Enhance And Promote Workplace DTE SS. Dispense information and present a thorough explanation of Tech Roles, Racial Group, Leadership Positions using the slides given. This template can be altered and personalized to fit your needs. It is also available for immediate download. So grab it now.


