Interactive Charts & Graphs PowerPoint Slides
-
 59551623 style essentials 2 financials 6 piece powerpoint presentation diagram infographic slide
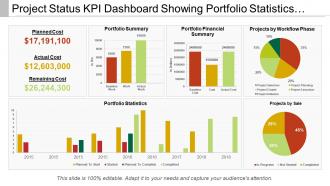
Presenting Project Status Kpi Dashboard Showing Portfolio Statistics And Workflow Phase PPT template. All around planned layout slide. This template slide is completely perfect with Google. Tend to upgrade the general effect of your introduction. Introduced to be spared in JPEG, JPG or PDF arrange whenever required. Space accessible to include your organization data as and when required. The format slide is famous and popular because of its simple utilize and openness. Basic and accommodating downloading by following clear advances. This slide keeps up the demonstrable skill of the introduction.
-
 Quality Key Performance Indicator Dashboard For Procurement
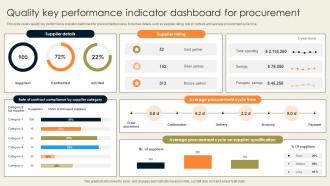
This slide covers quality key performance indicator dashboard Snapshot for procurement process. It involves details such as supplier rating, rate of contract and average procurement cycle time. Presenting our well structured Quality Key Performance Indicator Dashboard For Procurement. The topics discussed in this slide are Supplier Details, Supplier Rating, Average Procurement Cycle Time. This is an instantly available PowerPoint presentation that can be edited conveniently. Download it right away and captivate your audience.
-
 Financial Forecasts Bakery Store Start Up Go To Market Strategy GTM SS
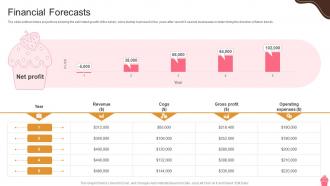
The slide outlines future projections showing the estimated growth of the bakery store startup business for five years after launch It assists businesses in determining the direction of future trends. Deliver an outstanding presentation on the topic using this Financial Forecasts Bakery Store Start Up Go To Market Strategy GTM SS Dispense information and present a thorough explanation of Financial Forecasts using the slides given. This template can be altered and personalized to fit your needs. It is also available for immediate download. So grab it now.
-
 Triage Security Dashboard To Detect Cybersecurity Issues
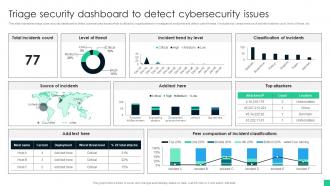
This slide represents triage cyber security dashboard to detect cybersecurity issues which is utilized by organizations to investigate its endpoints and detect cyber threats. It includes key components such as total incidents count, level of threat, etc Introducing our Triage Security Dashboard To Detect Cybersecurity Issues set of slides. The topics discussed in these slides are Incident Trend By Level, Classification Of Incidents, Top Attackers. This is an immediately available PowerPoint presentation that can be conveniently customized. Download it and convince your audience.
-
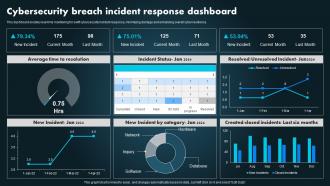 Cybersecurity Breach Incident Response Dashboard
This dashboard enables real-time monitoring for swift cybersecurity incident response, minimizing damage and enhancing overall cyber resilience. Presenting our well structured Cybersecurity Breach Incident Response Dashboard. The topics discussed in this slide are Cybersecurity Breach, Incident Response Dashboard, Overall Cyber Resilience. This is an instantly available PowerPoint presentation that can be edited conveniently. Download it right away and captivate your audience.
-
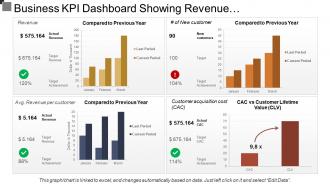 40357147 style essentials 2 financials 4 piece powerpoint presentation diagram infographic slide
Presenting this set of slides with name - Business Kpi Dashboard Showing Revenue And Customer Lifetime Value. This is a four stage process. The stages in this process are Business Dashboard, Business Kpi, Business Performance.
-
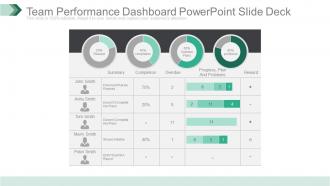 68367783 style division donut 4 piece powerpoint presentation diagram infographic slide
Presenting team performance dashboard powerpoint slide deck. This is a team performance dashboard powerpoint slide deck. This is a four stage process. The stages in this process are completion, overdue plans, problems, summary, completion, overdue, progress, plan and problems, reward.
-
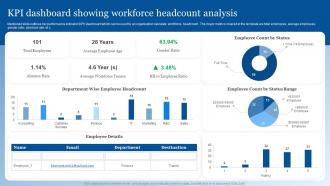 KPI Dashboard Showing Workforce Headcount Analysis
Mentioned slide outlines key performance indicator KPI dashboard which can be used by an organization calculate workforce headcount . The major metrics covered in the template are total employees, average employees, gender ratio, absence rate, et c. Introducing our KPI Dashboard Snapshot Showing Workforce Headcount Analysis set of slides. The topics discussed in these slides are KPI Dashboard, Showing Workforce, Headcount Analysis. This is an immediately available PowerPoint presentation that can be conveniently customized. Download it and convince your audience.
-
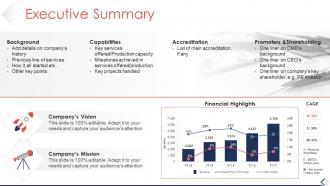 52956137 style concepts 1 growth 5 piece powerpoint presentation diagram infographic slide
Presenting Executive Summary PowerPoint Slide Download template. You can include charts and graphs for a clear representation of facts. The PPT also supports the standard (4:3) and widescreen (16:9) aspect ratios. It is having compatibility with Google Slides. Save this into common images or document formats like JPEG, PNG, or PDF. High-quality graphics will ensure that picture quality does not deteriorate.
-
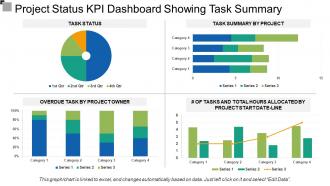 63007252 style essentials 2 financials 4 piece powerpoint presentation diagram infographic slide
Presentation template is attainable in standard and widescreen view. Presentation slides created with high quality resolution design. Totally variable design as color, text and font can be edited with ease. PPT slide easy to download with different slides. Easy to transmute the presentation slide into JPEG and PDF document. Download is quick. PowerPoint slide helps you to save time and effort. Just enter the business information and share with your shareholders, clients, team etc. Professionally crafted with concept in mind.
-
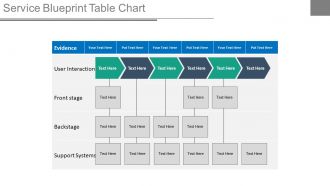 65907767 style hierarchy flowchart 1 piece powerpoint presentation diagram infographic slide
Specially fabricated PPT design templates favorable for different business professionals from varied sectors, clearly rectifiable shapes, patterns and subject matters, Dynamic compositions available in which these PPT graphics can be easily exportable, quiet enchanting for the interest of potential audiences, Very convincing and admissible Presentation graphics with malleable data options, Abrupt Downloads. The stages in this process are management, strategy, business
-
 Business analytics powerpoint presentation slides
Presenting this set of slides with name - Business Analytics Powerpoint Presentation Slides. Enhance your audience's knowledge with this well researched complete deck. This deck comprises of a total of thirty-six slides with each slide explained in detail. Each template comprises of professional diagrams and layouts. Our professional PowerPoint experts have also included icons, graphs, and charts for your convenience. These PPT slides are completely customizable. Make changes as per the requirement. Download PowerPoint templates in both widescreen and standard screen. The presentation is fully supported by Google Slides. It can be easily converted into JPG or PDF format.
-
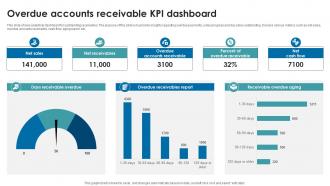 Overdue accounts receivable KPI dashboard
This slide shows analytical dashboard for outstanding receivables. The purpose of this slide is to provide insights regarding overdue payments, sales progress and day sales outstanding. It covers various metrics such as net sales, overdue accounts receivable, cash flow, aging report, etc.Presenting our well structured Overdue accounts receivable KPI dashboard. The topics discussed in this slide are Overdue Receivables Report, Receivable Overdue Aging, Overdue Receivable. This is an instantly available PowerPoint presentation that can be edited conveniently. Download it right away and captivate your audience.
-
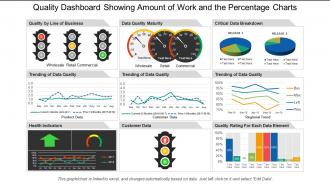 52378135 style essentials 2 financials 3 piece powerpoint presentation diagram infographic slide
SlideTeam feels immense pleasure in presenting to you its 100% customizable and user-friendly quality dashboard snapshot showing customer data with data quality. The business slides can be viewed in widescreen display ratio of 16:9 or standard size display ratio of 4:3 after being downloaded. The PPT presentation lets you insert or remove any given feature from the redesigned set of slides. You can also save the slideshow in format of PDF or JPG and also it is compatible with Google Slides. So hit download, edit it and present it.
-
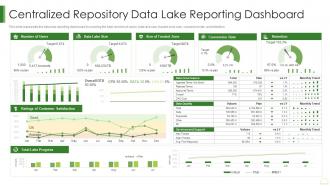 Data Lake It Centralized Repository Data Lake Reporting Dashboard
This slide represents the data lake reporting dashboard by covering the total number of users, total lake size, trusted zone size, conversion rate, and retention. Present the topic in a bit more detail with this Data Lake It Centralized Repository Data Lake Reporting Dashboard Snapshot. Use it as a tool for discussion and navigation on Centralized, Repository, Dashboard. This template is free to edit as deemed fit for your organization. Therefore download it now.
-
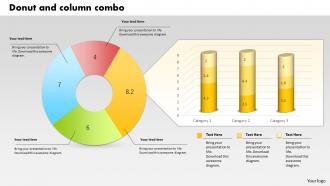 0414 donut and column business charts powerpoint graph
Entirely editable PowerPoint presentation slide. Adaptable with several software programs like JPEG and PDF. Preference to include and remove content as per the commerce need. Available in both standard as well as in widescreen slide. Gives a professional perspective to your PowerPoint slide. Personalization of PPT template is possible as per your requirement. Similar samples available with different nodes and stages.
-
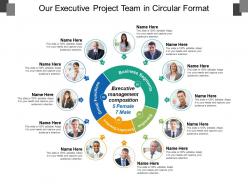 59026442 style essentials 1 our team 2 piece powerpoint presentation diagram infographic slide
• Impressive picture quality. • High resolution slide design. • Well crafted, aesthetically sound and professionally proficient. • Ease of download. • Ease of executing changes in the slide content. • Harmonious with multiple numbers of software options. • Harmonious with numerous slide design software. • Easy to customize and personalize with company specific name, logo and trademark. • Used by company professionals, teachers and students.
-
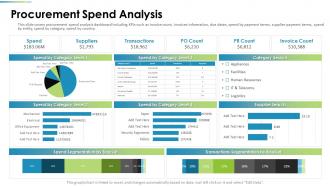 Procurement Analysis Procurement Spend Analysis Ppt Topics
This slide covers procurement spend analysis dashboard including KPIs such as invoice count, invoices information, due dates, spend by payment terms, supplier payment terms, spend by entity, spend by category, spend by country. Present the topic in a bit more detail with this Procurement Analysis Procurement Spend Analysis Ppt Topics. Use it as a tool for discussion and navigation on Procurement Spend Analysis. This template is free to edit as deemed fit for your organization. Therefore download it now.
-
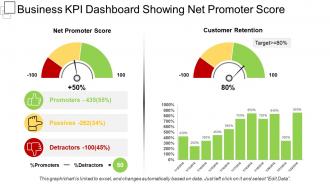 51964122 style essentials 2 financials 2 piece powerpoint presentation diagram infographic slide
Presenting this set of slides with name - Business Kpi Dashboard Snapshot Showing Net Promoter Score. This is a two stage process. The stages in this process are Business Dashboard, Business Kpi, Business Performance.
-
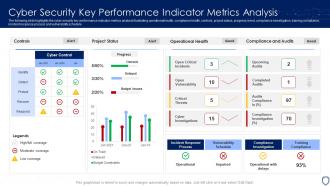 Cyber Security Key Performance Indicator Metrics Analysis
The following slide highlights the cyber security key performance indicator metrics analysis illustrating operational health, compliance health, controls, project status, progress, trend, compliance investigation, training compliance, incident response process and vulnerability schedule. Presenting our well structured Cyber Security Key Performance Indicator Metrics Analysis. The topics discussed in this slide are Incident Response Process, Vulnerability Schedule, Training Compliance. This is an instantly available PowerPoint presentation that can be edited conveniently. Download it right away and captivate your audience.
-
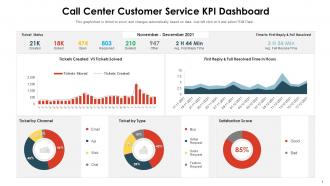 Call center customer service kpi dashboard
Introducing our Call Center Customer Service KPI Dashboard set of slides. The topics discussed in these slides are Call Center Customer Service KPI Dashboard. This is an immediately available PowerPoint presentation that can be conveniently customized. Download it and convince your audience.
-
 Business idea generation process flow currency loss ppt icons graphics
Presenting business idea generation process flow currency loss ppt icons graphics. This Power Point icon template diagram has been crafted with graphic of business icons. This icon PPT diagram contains the concept of business idea generation and process flow indication. Use this icon PPT for business and finance related presentations.
-
 Employee turnover chart with termination reasons and service length
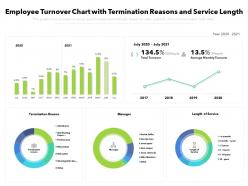
Presenting this set of slides with name Employee Turnover Chart With Termination Reasons And Service Length. The topics discussed in these slides are Termination Reason, Manager, Length Of Service. This is a completely editable PowerPoint presentation and is available for immediate download. Download now and impress your audience.
-
 Customer service metrics dashboard ppt gallery grid
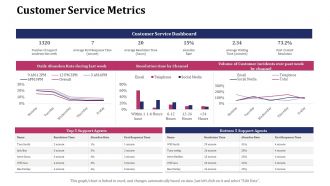
Presenting this set of slides with name Customer Service Metrics Dashboard Ppt Gallery Grid. The topics discussed in these slides are Customer Service Metrics. This is a completely editable PowerPoint presentation and is available for immediate download. Download now and impress your audience.
-
 Project Management Tracking System Kpis
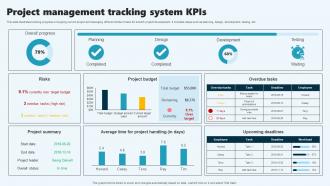
This slide illustrates tracking progress of ongoing current project and managing different kinds of risks for smooth project development. It includes steps such as planning, design, development, testing, etc. Presenting our well structured Project Management Tracking System Kpis. The topics discussed in this slide are Planning, Design, Development. This is an instantly available PowerPoint presentation that can be edited conveniently. Download it right away and captivate your audience.
-
 Three level segmentation of peoples ppt graphics icons
We are proud to present our three level segmentation of peoples ppt graphics icons. Three level segmentation has been displayed in this power point template with suitable graphics. This PPT diagram contains the graphics of groups. Use this PPT diagram for business and sales strategy related topics in any presentation.
-
 Cybersecurity dashboard with risk and compliance
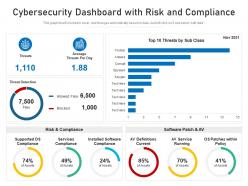
Introducing our Cybersecurity Dashboard With Risk And Compliance set of slides. The topics discussed in these slides are Services Compliance, Threat Detection, Risk And Compliance. This is an immediately available PowerPoint presentation that can be conveniently customized. Download it and convince your audience.
-
 36035829 style layered vertical 8 piece powerpoint presentation diagram infographic slide
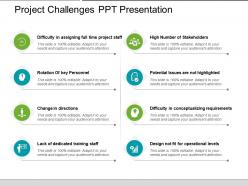
This project challenges PPT template allows full editing. You can change the font type, color, size, shape, style according to your customized business preferences. Insert business logo, trademarks to personalize the design. PPT design can instantly be downloaded and converted into JPEG and PDF formats. You can view the design template in both standard and wide screen. Slideshow is fully compatible with Google Slides and MS PowerPoint software.
-
 Internal audit dashboard overview of internal audit planning checklist
Deliver an outstanding presentation on the topic using this Internal Audit Dashboard Overview Of Internal Audit Planning Checklist Dispense information and present a thorough explanation of Risk Rating Of The Planned, Status Of The Planned Audits, Result Of Completed Audits using the slides given. This template can be altered and personalized to fit your needs. It is also available for immediate download. So grab it now.
-
 Employee Survey Results Strategic Human Resource Retention Management
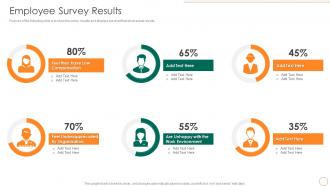
Purpose of the following slide is to show the survey results as it displays pie chart that show actual results.Present the topic in a bit more detail with this Employee Survey Results Strategic Human Resource Retention Management Use it as a tool for discussion and navigation on Underappreciated Organization, Unhappy Environment, Feel Compensation This template is free to edit as deemed fit for your organization. Therefore download it now.
-
 catering and restaurant marketing analysis dashboard snapshot
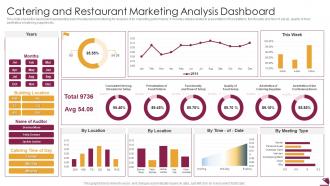
This slide shows the dashboard snapshot representing data of restaurant and catering for analysis of its marketing performance. It includes details related to presentation of food platters, functionality and flow of set up, quality of food, aesthetics of catering supplies etc. Introducing our Catering And Restaurant Marketing Analysis Dashboard set of slides. The topics discussed in these slides are Catering And Restaurant Marketing Analysis Dashboard. This is an immediately available PowerPoint presentation that can be conveniently customized. Download it and convince your audience.
-
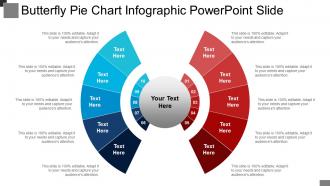 99603059 style circular semi 10 piece powerpoint presentation diagram infographic slide
Presenting butterfly pie chart infographic PowerPoint slide. Change PowerPoint slide structure, font, text, color and design as per your requirements. Easy data entry options to put in company logo, brand or name. Ideal for marketing professionals, business managers, entrepreneurs and big organizations. This presentation theme is totally in sync with Google slide. Easy conversion to other software’s like JPG and PDF formats. Image quality remains the unchanged even when resize the image or portray on large screens.
-
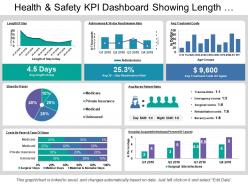 96914002 style essentials 2 financials 7 piece powerpoint presentation diagram infographic slide
Presenting this set of slides with name - Health And Safety Kpi Dashboard Showing Length Of Stay And Treatment Costs. This is a seven stage process. The stages in this process are Health And Safety, Health And Security, Health And Protection.
-
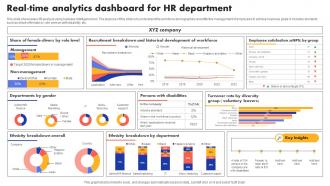 Real Time Analytics Dashboard For HR Department
This slide showcases HR analysis using business intelligence tool. The purpose of this slide is to understand the workforce demographics and effective management of employees to achieve business goals. It includes elements such as share of female by role, person with disability, etc. Presenting our well structured Real Time Analytics Dashboard For HR Department. The topics discussed in this slide are Departments By Gender, Persons With Disabilities. This is an instantly available PowerPoint presentation that can be edited conveniently. Download it right away and captivate your audience.
-
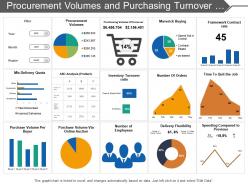 3667759 style essentials 2 financials 4 piece powerpoint presentation diagram infographic slide
Presenting this set of slides with name - Procurement Volumes And Purchasing Turnover Dashboard. This is a four stage process. The stages in this process are Purchase, Procurement, Buy.
-
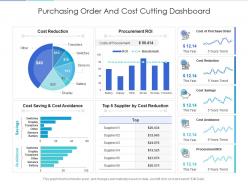 Purchasing order and cost cutting dashboard powerpoint template
If you are looking for a perfect template to display metrics and insights, then this template titled Purchasing Order And Cost Cutting Dashboard Snapshot Powerpoint Template is the best choice. Deploy this PowerPoint presentation slide to evaluate the status of a campaign or identify different trends that affect the working culture of your organization. It offers a well-structured layout with many graphical representations to display real-time information. Our PPT slide can also be used as a measurement and comparison tool to weigh in different prospects in achieving your end goal. Additionally, this is a very useful set to share with higher authorities to help them make informed decisions based on analytical data and insights. The biggest advantage of this PowerPoint layout is that it has built-in features and graphics that make it easy to modify. Therefore, grab it now.
-
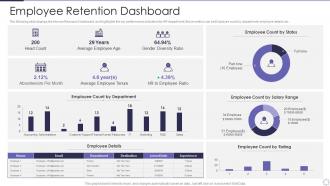 Managing Employee Turnover Employee Retention Dashboard Ppt Infographics Slide
The following slide displays the Human Resource Dashboard, as it highlights the key performance indicators for HR department, these metrics can be Employee count by department, employee details etc. Deliver an outstanding presentation on the topic using this Managing Employee Turnover Employee Retention Dashboard Ppt Infographics Slide. Dispense information and present a thorough explanation of Average Employee Age, Diversity Ratio, Employee Details using the slides given. This template can be altered and personalized to fit your needs. It is also available for immediate download. So grab it now.
-
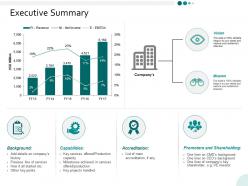 91010229 style essentials 2 financials 6 piece powerpoint presentation diagram infographic slide
Presenting this set of slides with name - Executive Summary Ppt Powerpoint Presentation Infographics Deck. This is a six stages process. The stages in this process are Finance, Marketing, Management, Investment, Analysis.
-
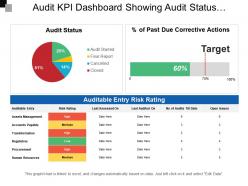 7447902 style essentials 2 financials 4 piece powerpoint presentation diagram infographic slide
Presenting this set of slides with name - Audit Kpi Dashboard Showing Audit Status Auditable Entry Risk Rating. This is a four stage process. The stages in this process are Audit, Examine, Survey.
-
 81797516 style hierarchy flowchart 1 piece powerpoint presentation diagram infographic slide
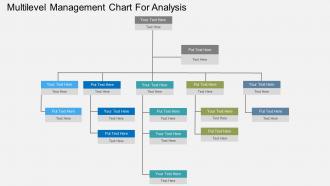
Use of high-resolution images in the slide icons. Compatible with the Google Slides or MS Office PowerPoint programs. Easy to edit and download. Trouble-free replacement of your company’s logo. Access to open on a big screen display. Provided instructions to edit and modify the slide icon. Beneficial for the marketing professionals and the business managers.
-
 35180838 style essentials 2 compare 2 piece powerpoint presentation diagram infographic slide
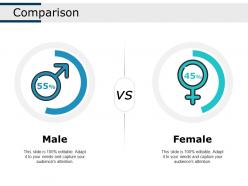
Presenting this set of slides with name - Comparison Ppt Show Infographic Template. This is a two stage process. The stages in this process are Male, Female, Comparison.
-
 19875835 style essentials 2 financials 3 piece powerpoint presentation diagram infographic slide
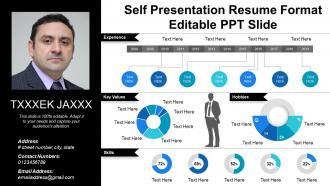
Presenting self presentation resume format editable PPT slide which is thoroughly editable, data driven i.e. excel linked and fast to download. The presenter can customize and personalize this PPT slide it to meet his / her own specifications. This presentation has been designed by plethora of professional expertise. This PowerPoint shape is fully compatible with Google Slides, multiple software and format options. This slideshow can be saved as JPG and / or in PDF. For your kind assistance, editing instructions are also provided.
-
 Recruitment Dashboard Metrics With Active Pipeline
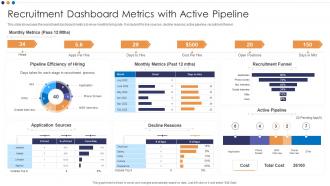
This slide showcases the recruitment dashboard metrics to know monthly hiring rate. It include KPIs like sources, decline reasons, active pipeline, recruitment funnel. Introducing our Recruitment Dashboard Metrics With Active Pipeline set of slides. The topics discussed in these slides are Recruitment Funnel, Decline Reasons, Application Sources. This is an immediately available PowerPoint presentation that can be conveniently customized. Download it and convince your audience.
-
 1214 six staged pie charts for text representation powerpoint slide
We are proud to present our 1214 six staged pie charts for text representation powerpoint slide. six staged pie charts are used to craft this power point template slide. This PPT slide contains the concept of process analysis. This analysis can be used for business and marketing related presentations.
-
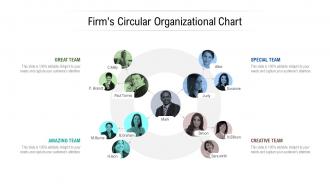 Firms circular organizational chart
Presenting this set of slides with name Firms Circular Organizational Chart. This is a four stage process. The stages in this process are Circular Organizational Chart, Hierarchy Organizational Chart, Interconnected Organizational Chart. This is a completely editable PowerPoint presentation and is available for immediate download. Download now and impress your audience.
-
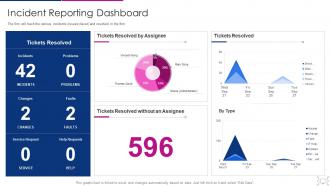 Cyber threat management workplace incident reporting dashboard snapshot
The firm will track the various incidents issues faced and resolved in the firm. Deliver an outstanding presentation on the topic using this Cyber Threat Management Workplace Incident Reporting Dashboard snapshot. Dispense information and present a thorough explanation of Tickets Resolved, Tickets Resolved By Assignee, Tickets Resolved, Tickets Resolved Assignee using the slides given. This template can be altered and personalized to fit your needs. It is also available for immediate download. So grab it now.
-
 Discussion on new idea for success ppt graphics icons
We are proud to present our discussion on new idea for success ppt graphics icons. Add this PPT diagram in your business presentations to show the concept of new idea generation. This PPT diagram contains the graphic of 3d man and board with bulb sketch. Use this PPT diagram for business success related topics in any presentations.
-
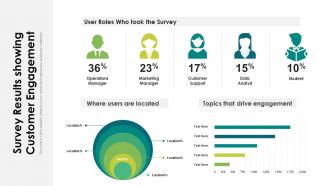 Survey results showing customer engagement
Presenting this set of slides with name Survey Results Showing Customer Engagement. The topics discussed in these slides are Operations Manager, Marketing Manager, Customer Support, Data Analyst. This is a completely editable PowerPoint presentation and is available for immediate download. Download now and impress your audience.
-
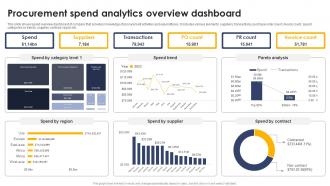 Procurement Spend Analytics Overview Dashboard
This slide shows spend overview dashboard of company that provides knowledge of procurement activities and expenditures. It includes various elements suppliers, transactions, purchase order count, invoice count, spend categories by trends, supplier, contract, region etc. Introducing our Procurement Spend Analytics Overview Dashboard set of slides. The topics discussed in these slides are Procurement Spend, Analytics Overview, Dashboard. This is an immediately available PowerPoint presentation that can be conveniently customized. Download it and convince your audience.
-
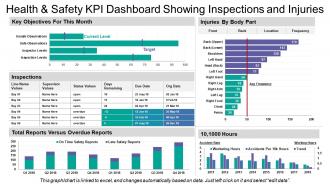 18379402 style essentials 2 financials 5 piece powerpoint presentation diagram infographic slide
Presenting this set of slides with name - Health And Safety Kpi Dashboard Showing Inspections And Injuries. This is a five stage process. The stages in this process are Health And Safety, Health And Security, Health And Protection.
-
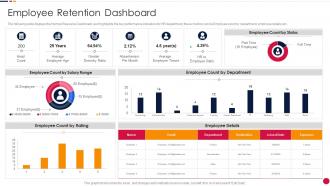 Employee Retention Dashboard Organization Attrition Rate Management
The following slide displays the Human Resource Dashboard, as it highlights the key performance indicators for HR department, these metrics can be Employee count by department, employee details etc. Present the topic in a bit more detail with this Employee Retention Dashboard Snapshot Organization Attrition Rate Management. Use it as a tool for discussion and navigation on Employee Retention Dashboard. This template is free to edit as deemed fit for your organization. Therefore download it now.
-
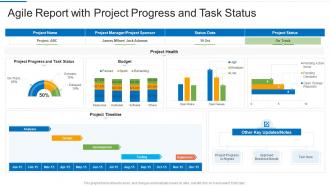 Agile report with project progress and task status
Introducing our Agile Report With Project Progress And Task Status set of slides. The topics discussed in these slides are Budget, Project Timeline, Implement, Development, Analysis. This is an immediately available PowerPoint presentation that can be conveniently customized. Download it and convince your audience.
-
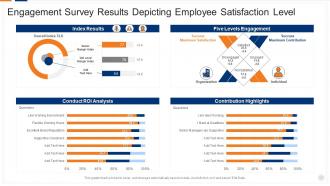 Engagement Survey Results Depicting Employee Satisfaction Level
Introducing our Engagement Survey Results Depicting Employee Satisfaction Level set of slides. The topics discussed in these slides are Engagement Survey Results Depicting Employee Satisfaction Level. This is an immediately available PowerPoint presentation that can be conveniently customized. Download it and convince your audience.
-
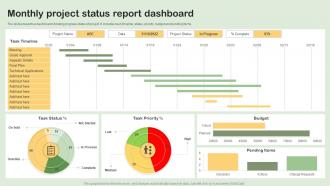 Monthly Project Status Report Dashboard
The slide presents a dashboard showing progress status of project. It includes task timeline, status, priority, budget and pending items. Introducing our Monthly Project Status Report Dashboard set of slides. The topics discussed in these slides are Monthly Project Status, Report, Dashboard. This is an immediately available PowerPoint presentation that can be conveniently customized. Download it and convince your audience.
-
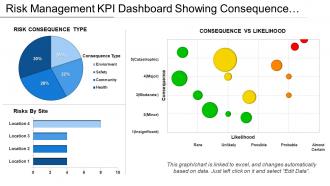 45331976 style essentials 2 financials 3 piece powerpoint presentation diagram infographic slide
Presenting this set of slides with name - Risk Management Kpi Dashboard Showing Consequence Vs Likelihood. This is a three stage process. The stages in this process are Risk Management, Risk Assessment, Project Risk.
-
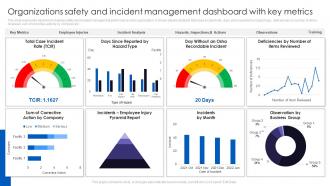 Organizations Safety And Incident Management Dashboard With Key Metrics
This slide represents dashboard showing safety and incident management performance of an organization. It shows details related to total case incident rate, days since reported by hazard type, deficiencies by number of items reviewed, sum of corrective actions by company etc. Introducing our Organizations Safety And Incident Management Dashboard With Key Metrics set of slides. The topics discussed in these slides are Employee Injuries, Incident Analysis, Observations. This is an immediately available PowerPoint presentation that can be conveniently customized. Download it and convince your audience.
-
 44298327 style essentials 2 compare 3 piece powerpoint presentation diagram infographic slide
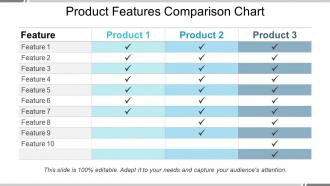
Presenting product features comparison chart PowerPoint design template. The slideshow allows full editing. Modify and customize the design by changing font type, color and other design elements. Quick and instant downloading on a single click available. High-resolution icons are used to explain the concept of product feature comparison matrix. Design template can be opened and edited with Google Slides and MS PowerPoint software.
-
 Okr dashboard with departmental progress
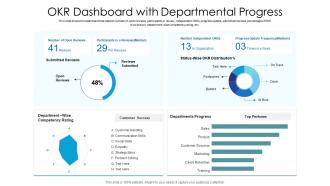
This slide shows the dashboard that depicts number of open reviews, participants in review, independent OKRs, progress update, submitted reviews, percentage of OKR distribution, department-wise competency rating, etc. Introducing our OKR Dashboard With Departmental Progress set of slides. The topics discussed in these slides are Customer Success, Organization, Departments Progress. This is an immediately available PowerPoint presentation that can be conveniently customized. Download it and convince your audience.
-
 98106489 style concepts 1 growth 7 piece powerpoint presentation diagram infographic slide
Visually stunning PPT presentation illustrations. Offers thousands of icons and numerous colours to alter the appearance. Beneficial for the organisations, investors, clients and customers. Capable of enhancing the image and profits of the enterprise. Completely professional look and feel. 100% modifiable as per the needs of the user.
-
 41593055 style essentials 2 financials 6 piece powerpoint presentation diagram template slide
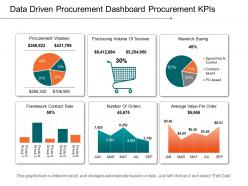
Pre-designed data driven procurement dashboard for Kpis presentation template. Can be used for statistical data analysis. High-resolution PowerPoint presentation backgrounds for better clarity of the information displayed. Offers wide variety of options and colors to alter the appearance. Allows adding of enterprise personal details such as brand name, logo and much more. Enough space available to enter text and its related points in the PPT table. This PPT Slide is available in both Standard and Widescreen slide size. Compatible with multiple formats like JPEG, PDF and Google slides.


