All Flat Designs Dashboards and Measuring Powerpoint Diagram Slide
-
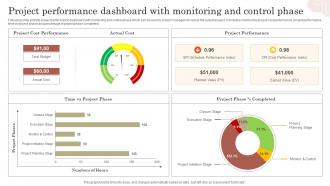 Project Performance Dashboard With Monitoring And Control Phase
Following slide exhibits project performance dashboard with monitoring and control phase which can be used by project managers to review the overall project. It includes metrics like project cost performance, project performance, time vs project phase and percentage of project phase completed. Introducing our Project Performance Dashboard With Monitoring And Control Phase set of slides. The topics discussed in these slides are Project Performance, Project Phases, Project Planning Stage. This is an immediately available PowerPoint presentation that can be conveniently customized. Download it and convince your audience.
-
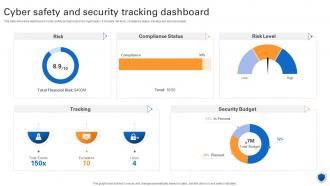 Cyber Safety And Security Tracking Dashboard
This slide shows the dashboard of cyber safety and security of an organization. It includes risk level, compliance status, tracking and security budget. Introducing our Cyber Safety And Security Tracking Dashboard set of slides. The topics discussed in these slides are Compliance Status, Risk Level, Security Budget. This is an immediately available PowerPoint presentation that can be conveniently customized. Download it and convince your audience.
-
 Sales Target Icon With KPIs And Calendar
Introducing our premium set of slides with Sales Target Icon With KPIs And Calendar. Ellicudate the four stages and present information using this PPT slide. This is a completely adaptable PowerPoint template design that can be used to interpret topics like Sales Target Icon, KPIs And Calendar. So download instantly and tailor it with your information.
-
 Effective Team Structuring Timeline Icon
Presenting our set of slides with Effective Team Structuring Timeline Icon. This exhibits information on four stages of the process. This is an easy to edit and innovatively designed PowerPoint template. So download immediately and highlight information on Effective Team Structuring, Timeline Icon.
-
 Project Status Summary Timeline Icon
Presenting our set of slides with Project Status Summary Timeline Icon. This exhibits information on three stages of the process. This is an easy to edit and innovatively designed PowerPoint template. So download immediately and highlight information on Project Status Summary, Timeline Icon.
-
 Performance As Pillar Of CDN Design Ppt Powerpoint Presentation Icon Background Images
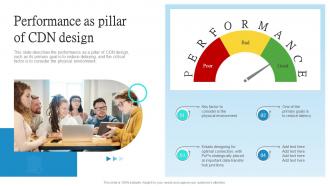
This slide describes the performance as a pillar of CDN design, such as its primary goal is to reduce delaying, and the critical factor is to consider the physical environment. Increase audience engagement and knowledge by dispensing information using Performance As Pillar Of CDN Design Ppt Powerpoint Presentation Icon Background Images. This template helps you present information on four stages. You can also present information on Primary Goals, Physical Environment, PoPs Strategically using this PPT design. This layout is completely editable so personaize it now to meet your audiences expectations.
-
 KPI Dashboard Highlighting Result Of Marketing Campaign Complete Guide To Develop Business
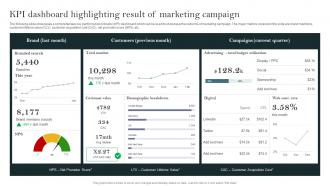
The following slide showcases a comprehensive key performance indicator KPI dashboard which can be used to showcase the outcome of marketing campaign. The major metrics covered in the slide are brand mentions, customer lifetime value CLV, customer acquisition cost CAC, net promoter score NPS, etc. Deliver an outstanding presentation on the topic using this KPI Dashboard Highlighting Result Of Marketing Campaign Complete Guide To Develop Business. Dispense information and present a thorough explanation of Branded Search, Budget Utilization, Customer Value using the slides given. This template can be altered and personalized to fit your needs. It is also available for immediate download. So grab it now.
-
 Dashboard To Track Overall Rebranding Campaigns Performance Ppt Summary Templates
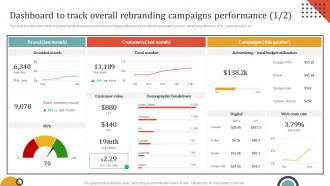
This slide provides information regarding dashboard to track rebranding campaigns effectiveness by detecting branded research, advertising efficiency, NPS, customer value, etc. Deliver an outstanding presentation on the topic using this Dashboard To Track Overall Rebranding Campaigns Performance Ppt Summary Templates. Dispense information and present a thorough explanation of Branded Search, Total Number, Budget Utilization using the slides given. This template can be altered and personalized to fit your needs. It is also available for immediate download. So grab it now.
-
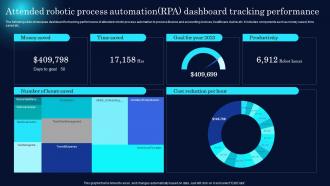 Attended Robotic Process Automation RPA Dashboard Tracking Performance
The following slide showcases dashboard for tracking performance of attended robotic process automation to process finance and accounting invoices, healthcare claims etc. It includes components such as money saved, time saved etc. Introducing our Attended Robotic Process Automation RPA Dashboard Tracking Performance set of slides. The topics discussed in these slides are Cost Reduction, Goal, Money Saved. This is an immediately available PowerPoint presentation that can be conveniently customized. Download it and convince your audience.
-
 Customer Health Score Measurement Scale Icon
Presenting our set of slides with Customer Health Score Measurement Scale Icon. This exhibits information on three stages of the process. This is an easy to edit and innovatively designed PowerPoint template. So download immediately and highlight information on Customer Health Score, Measurement Scale Icon.
-
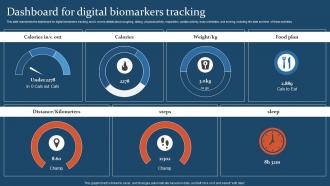 Dashboard For Digital Biomarkers Tracking Ppt Slides Graphics Tutorials
This slide represents the dashboard for digital biomarkers tracking, and it covers details about coughing, talking, physical activity, respiration, cardiac activity, body orientation, and snoring, including the date and time of these activities. Present the topic in a bit more detail with this Dashboard For Digital Biomarkers Tracking Ppt Slides Graphics Tutorials. Use it as a tool for discussion and navigation on Dashboard, Digital, Biomarkers Tracking. This template is free to edit as deemed fit for your organization. Therefore download it now.
-
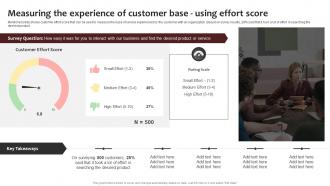 C52 Measuring The Experience Of Customer New Brand Awareness Strategic Plan Branding SS
Mentioned slide shows customer effort score that can be used to measure the ease of service experienced by the customer with an organization. Based on survey results, 28 percent said that it took a lot of effort in searching the desired product. Deliver an outstanding presentation on the topic using this C52 Measuring The Experience Of Customer New Brand Awareness Strategic Plan Branding SS. Dispense information and present a thorough explanation of Customer Effort Score, Rating Scale, Key Takeaways using the slides given. This template can be altered and personalized to fit your needs. It is also available for immediate download. So grab it now.
-
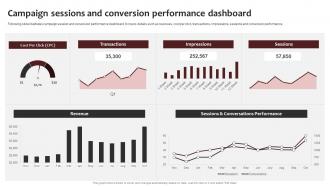 Campaign Sessions And Conversion New Brand Awareness Strategic Plan Branding SS
Following slide illustrates campaign session and conversion performance dashboard. It covers details such as revenues, cost per click, transactions, impressions, sessions and conversion performance. Present the topic in a bit more detail with this Campaign Sessions And Conversion New Brand Awareness Strategic Plan Branding SS. Use it as a tool for discussion and navigation on Transactions, Impressions, Sessions. This template is free to edit as deemed fit for your organization. Therefore download it now.
-
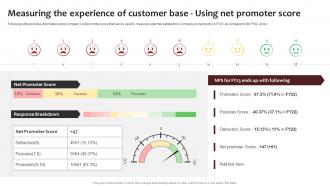 Measuring The Experience Of Customer New Brand Awareness Strategic Plan Branding SS
Following slide provides information about companys net promoter score that can be used to measure customer satisfaction. Company scored poorly in FY23 as compared to its FY22 score. Deliver an outstanding presentation on the topic using this Measuring The Experience Of Customer New Brand Awareness Strategic Plan Branding SS Dispense information and present a thorough explanation of Net Promoter Score, Response Breakdown, Detractors Score using the slides given. This template can be altered and personalized to fit your needs. It is also available for immediate download. So grab it now.
-
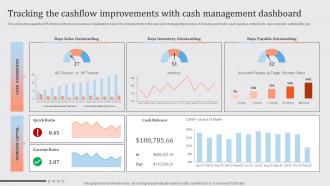 Streamlined Financial Strategic Plan Tracking The Cashflow Improvements
This slide showcases the KPIs that would help our business organization to track the improvements in the new cash management process. It includes quick ratio, cash balance, current ratio, days inventory outstanding, etc. Present the topic in a bit more detail with this Streamlined Financial Strategic Plan Tracking The Cashflow Improvements. Use it as a tool for discussion and navigation on Improvements, Cash, Inventory. This template is free to edit as deemed fit for your organization. Therefore download it now.
-
 Improving Employee Retention Rate Dashboard To Analyze Flexible Working Strategies Impact
The following slide delineates a key performance indicator KPI dashboard through which managers can evaluate the success of a flexible working policy on workforce performance. The major KPIs are absenteeism rate, overall labor effectiveness etc. Present the topic in a bit more detail with this Improving Employee Retention Rate Dashboard To Analyze Flexible Working Strategies Impact. Use it as a tool for discussion and navigation on Absenteeism, Department, Overall Labor Effectiveness. This template is free to edit as deemed fit for your organization. Therefore download it now.
-
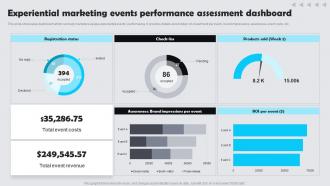 Experiential Marketing Events Performance Assessment Dashboard Customer Experience
This slide showcases dashboard which can help marketers assess experiential events performance. It provides details about return on investment per event, brand impressions, awareness, event costs, etc. Deliver an outstanding presentation on the topic using this Experiential Marketing Events Performance Assessment Dashboard Customer Experience. Dispense information and present a thorough explanation of Registration Status, Awareness, Total Event Costs using the slides given. This template can be altered and personalized to fit your needs. It is also available for immediate download. So grab it now.
-
 Assessment Of Current Customer Services Customer Journey Optimization
This slide highlight the results of current customer support services that represents the key major concerns such as poor customer service, low retention rate, and increasing call duration time etc. Deliver an outstanding presentation on the topic using this Assessment Of Current Customer Services Customer Journey Optimization. Dispense information and present a thorough explanation of Services, Revenue, Average using the slides given. This template can be altered and personalized to fit your needs. It is also available for immediate download. So grab it now.
-
 Business Tactics For Time Management Icon
Presenting our set of slides with Business Tactics For Time Management Icon. This exhibits information four stages of the process. This is an easy to edit and innovatively designed PowerPoint template. So download immediately and highlight information on Business Tactics, Time Management Icon.
-
 Evaluating Projected Vs Actual Sales Performance Identifying Risks In Sales Management Process
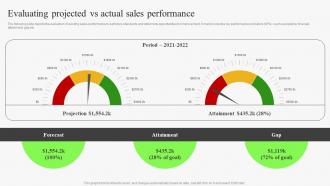
The following slide depicts the evaluation of existing sales performance to set future standards and determine opportunities for improvement. It mainly includes key performance indicators KPIs such as pipeline, forecast, attainment, gap etc. Deliver an outstanding presentation on the topic using this Evaluating Projected Vs Actual Sales Performance Identifying Risks In Sales Management Process. Dispense information and present a thorough explanation of Period, Forecast, Attainment using the slides given. This template can be altered and personalized to fit your needs. It is also available for immediate download. So grab it now.
-
 Department Of Energy Lesson Learned Process
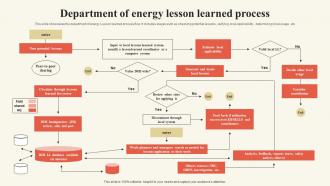
This slide showcases the department of energy Lesson learned process flow. It includes stages such as observing potential lessons , verifying local applicability , determining local usage , etc. Introducing our premium set of slides with Department Of Energy Lesson Learned Process. Ellicudate the one stages and present information using this PPT slide. This is a completely adaptable PowerPoint template design that can be used to interpret topics like Department, Process, Local Lessons. So download instantly and tailor it with your information.
-
 Dashboard For Measuring Customer Optimizing Retail Operations By Efficiently Handling Inventories
Mentioned slide illustrates customer satisfaction dashboard. It includes information about net promoter score, customer retention rate and customer effort score. Deliver an outstanding presentation on the topic using this Dashboard For Measuring Customer Optimizing Retail Operations By Efficiently Handling Inventories. Dispense information and present a thorough explanation of Customer, Satisfaction, Retention using the slides given. This template can be altered and personalized to fit your needs. It is also available for immediate download. So grab it now.
-
 Determining Back Order Rate And Optimizing Retail Operations By Efficiently Handling Inventories
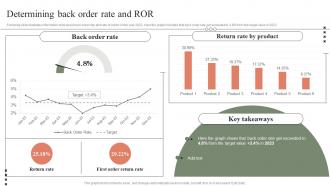
Following slide illustrates information stats about back order rate and rate of return in the year 2023. Here the graph indicates that back order rate get exceeded to 4.8 percentage from the target value in 2023 Deliver an outstanding presentation on the topic using this Determining Back Order Rate And Optimizing Retail Operations By Efficiently Handling Inventories. Dispense information and present a thorough explanation of Order, Return, Product using the slides given. This template can be altered and personalized to fit your needs. It is also available for immediate download. So grab it now.
-
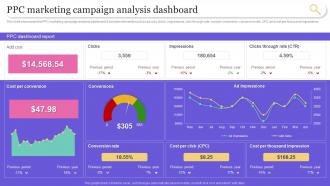 PPC Marketing Campaign Analysis Search Engine Marketing To Generate Qualified Traffic MKT SS
This slide showcases the PPC marketing campaign analysis dashboard. It includes elements such as ad cost, clicks, impressions, click through rate, cost per conversion, conversion rate, CPC and cost per thousand impressions Deliver an outstanding presentation on the topic using this PPC Marketing Campaign Analysis Search Engine Marketing To Generate Qualified Traffic MKT SS. Dispense information and present a thorough explanation of Marketing, Campaign, Analysis using the slides given. This template can be altered and personalized to fit your needs. It is also available for immediate download. So grab it now.
-
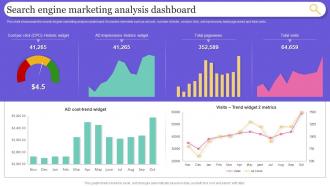 Search Engine Marketing Analysis Search Engine Marketing To Generate Qualified Traffic MKT SS
This slide showcases the search engine marketing analysis dashboard. It includes elements such as ad cost , number of visits, cost per click, ad impressions, total page views and total visits. Deliver an outstanding presentation on the topic using this Search Engine Marketing Analysis Search Engine Marketing To Generate Qualified Traffic MKT SS. Dispense information and present a thorough explanation of Search, Engine, Marketing using the slides given. This template can be altered and personalized to fit your needs. It is also available for immediate download. So grab it now.
-
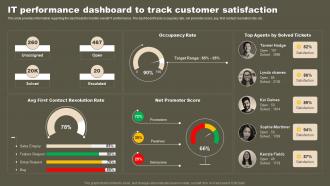 IT Performance Dashboard To Track Customer Strategic Initiatives To Boost IT Strategy SS V
This slide provides information regarding the dashboard to monitor overall IT performance. The dashboard tracks occupancy rate, net promoter score, avg. first contact resolution rate, etc. Present the topic in a bit more detail with this IT Performance Dashboard To Track Customer Strategic Initiatives To Boost IT Strategy SS V. Use it as a tool for discussion and navigation on Satisfaction, Track, Performance. This template is free to edit as deemed fit for your organization. Therefore download it now.
-
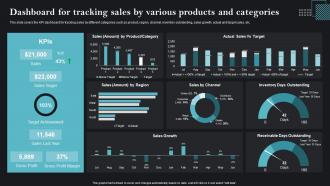 Dashboard For Tracking Sales By Various Sales Strategies To Achieve Business MKT SS
This slide covers the KPI dashboard for tracking sales by different categories such as product, region, channel, inventory outstanding, sales growth, actual and target sales, etc. Deliver an outstanding presentation on the topic using this Dashboard For Tracking Sales By Various Sales Strategies To Achieve Business MKT SS. Dispense information and present a thorough explanation of Sales, Product, Category using the slides given. This template can be altered and personalized to fit your needs. It is also available for immediate download. So grab it now.
-
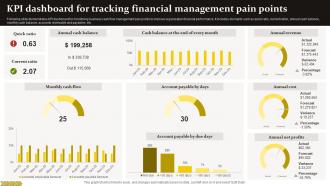 KPI Dashboard For Tracking Financial Management Pain Points
Following slide demonstrates KPI dashboard for monitoring business cash flow management pain points to improve organisation financial performance. It includes elements such as quick ratio, current ration, annual cash balance, monthly cash balance, accounts receivable and payables, etc. Introducing our KPI Dashboard For Tracking Financial Management Pain Points set of slides. The topics discussed in these slides are Tracking, Financial, Management. This is an immediately available PowerPoint presentation that can be conveniently customized. Download it and convince your audience.
-
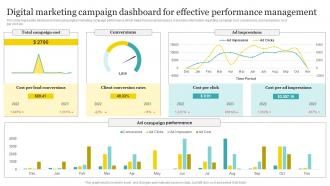 Digital Marketing Campaign Dashboard For Effective Performance Management
This slide represents dashboard showcasing digital marketing campaign performance which helps track project progress. It provides information regarding campaign cost, conversions, ad impressions, cost per click etc. Introducing our Digital Marketing Campaign Dashboard For Effective Performance Management set of slides. The topics discussed in these slides are Digital, Marketing, Effective. This is an immediately available PowerPoint presentation that can be conveniently customized. Download it and convince your audience.
-
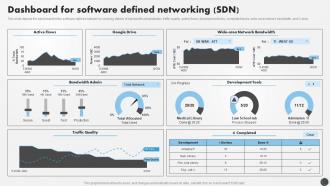 SDN Security IT Dashboard For Software Defined Networking SDN
This slide depicts the dashboard for the software defined network by covering details of bandwidth administrator, traffic quality, active flows, development tools, completed tasks, wide-area network bandwidth, and G drive. Deliver an outstanding presentation on the topic using this SDN Security IT Dashboard For Software Defined Networking SDN. Dispense information and present a thorough explanation of Software, Networking, Network using the slides given. This template can be altered and personalized to fit your needs. It is also available for immediate download. So grab it now.
-
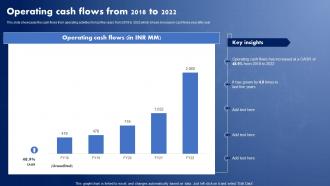 IT Solutions Company Profile Operating Cash Flows From 2018 To 2022 CP SS V
This slide showcases the cash flows from operating activities for last five years from 2018 to 2022 which shows increase in cash flows year after year Deliver an outstanding presentation on the topic using this IT Solutions Company Profile Operating Cash Flows From 2018 To 2022 CP SS V. Dispense information and present a thorough explanation of Operating, Cash, Grown using the slides given. This template can be altered and personalized to fit your needs. It is also available for immediate download. So grab it now.
-
 Dashboard For Tracking Business Digital Marketing Analytics For Better Business
This slide covers the dashboard for analyzing blogging KPIs such as performance, published posts, views, new blog subscribers, top blog posts by pageviews, top blog posts by CTR, etc. Deliver an outstanding presentation on the topic using this Dashboard For Tracking Business Digital Marketing Analytics For Better Business. Dispense information and present a thorough explanation of Blogging Performance, Top Blog, Blog Post using the slides given. This template can be altered and personalized to fit your needs. It is also available for immediate download. So grab it now.
-
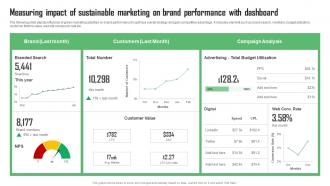 Measuring Impact Of Sustainable Marketing On Green Marketing Guide For Sustainable Business MKT SS
The following slide depicts influence of green marketing activities on brand performance to optimize overall strategy and gain competitive advantage. It includes element such as brand search, mentions, budget utilization, customer lifetime value, website conversion rate etc. Present the topic in a bit more detail with this Measuring Impact Of Sustainable Marketing On Green Marketing Guide For Sustainable Business MKT SS. Use it as a tool for discussion and navigation on Impact, Marketing, Performance. This template is free to edit as deemed fit for your organization. Therefore download it now.
-
 KPI Dashboard To Measure Customer Service Digital Transformation Process For Contact Center
This slide represents dashboard to measure customer service performance. It includes number of issues, average time to close, average response time etc. Deliver an outstanding presentation on the topic using this KPI Dashboard To Measure Customer Service Digital Transformation Process For Contact Center. Dispense information and present a thorough explanation of Measure, Customer, Performance using the slides given. This template can be altered and personalized to fit your needs. It is also available for immediate download. So grab it now.
-
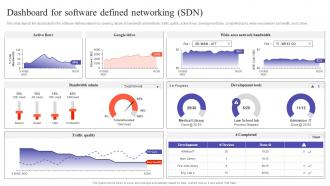 SDN Development Approaches Dashboard For Software Defined Networking SDN
This slide depicts the dashboard for the software defined network by covering details of bandwidth administrator, traffic quality, active flows, development tools, completed tasks, wide area network bandwidth, and G drive. Present the topic in a bit more detail with this SDN Development Approaches Dashboard For Software Defined Networking SDN. Use it as a tool for discussion and navigation on Software, Defined, Networking. This template is free to edit as deemed fit for your organization. Therefore download it now.
-
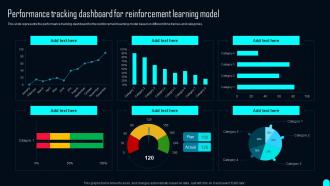 Performance Tracking Dashboard For Elements Of Reinforcement Learning
This slide represents the performance tracking dashboard for the reinforcement learning model based on different time frames and categories. Present the topic in a bit more detail with this Performance Tracking Dashboard For Elements Of Reinforcement Learning. Use it as a tool for discussion and navigation on Performance, Tracking, Learning. This template is free to edit as deemed fit for your organization. Therefore download it now.
-
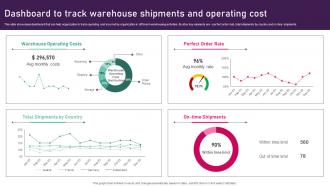 Dashboard To Track Warehouse Shipments And Operating Inventory Management Techniques To Reduce
This slide showcases dashboard that can help organization to track operating cost incurred by organization in different warehousing activities. Its other key elements are - perfect order rate, total shipments by country and on time shipments. Present the topic in a bit more detail with this Dashboard To Track Warehouse Shipments And Operating Inventory Management Techniques To Reduce. Use it as a tool for discussion and navigation on Track, Warehouse, Operating. This template is free to edit as deemed fit for your organization. Therefore download it now.
-
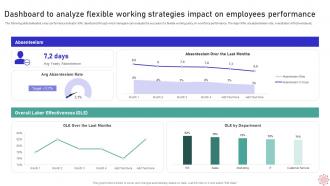 Dashboard To Analyze Flexible Working Strategies Impact On Implementing WFH Policy Post Covid 19
The following slide delineates a key performance indicator KPI dashboard through which managers can evaluate the success of a flexible working policy on workforce performance. The major KPIs are absenteeism rate, overall labor effectiveness etc. Present the topic in a bit more detail with this Dashboard To Analyze Flexible Working Strategies Impact On Implementing WFH Policy Post Covid 19. Use it as a tool for discussion and navigation on Analyze, Flexible, Strategies. This template is free to edit as deemed fit for your organization. Therefore download it now.
-
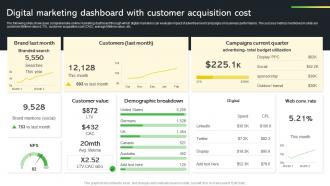 Digital Marketing Dashboard With Customer Creative Startup Marketing Ideas To Drive Strategy SS V
The following slide showcases comprehensive online marketing dashboard through which digital marketers can evaluate impact of advertisement campaigns on business performance. The success metrics mentioned in slide are customer lifetime value LTV, customer acquisition cost CAC, average lifetime value, etc. Deliver an outstanding presentation on the topic using this Digital Marketing Dashboard With Customer Creative Startup Marketing Ideas To Drive Strategy SS V. Dispense information and present a thorough explanation of Marketing, Customer, Cost using the slides given. This template can be altered and personalized to fit your needs. It is also available for immediate download. So grab it now.
-
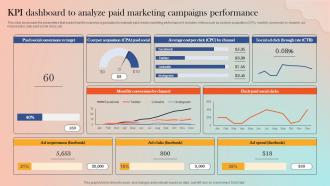 KPI Dashboard To Analyze Paid Marketing Campaigns Strategies For Adopting Paid Marketing MKT SS V
This slide showcases the parameters that would help the business organization to evaluate paid media marketing performance. It includes metrics such as cost per acquisition CPA, monthly conversion by channel, ad impressions, daily paid social clicks, etc. Deliver an outstanding presentation on the topic using this KPI Dashboard To Analyze Paid Marketing Campaigns Strategies For Adopting Paid Marketing MKT SS V. Dispense information and present a thorough explanation of Analyze, Paid, Performance using the slides given. This template can be altered and personalized to fit your needs. It is also available for immediate download. So grab it now.
-
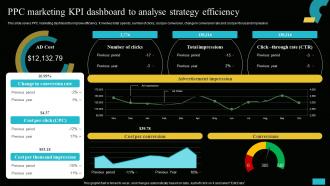 PPC Marketing KPI Dashboard To Analyse Strategy Implementing MIS To Increase Sales MKT SS V
This slide covers PPC marketing dashboard to improve efficiency. It involves total spends, number of clicks, cost per conversion, change in conversion rate and cost per thousand impression. Deliver an outstanding presentation on the topic using this PPC Marketing KPI Dashboard To Analyse Strategy Implementing MIS To Increase Sales MKT SS V. Dispense information and present a thorough explanation of Marketing, Strategy, Efficiency using the slides given. This template can be altered and personalized to fit your needs. It is also available for immediate download. So grab it now.
-
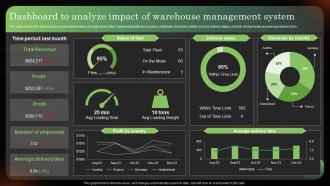 Dashboard To Analyze Impact Of Warehouse Management Logistics Strategy To Improve Supply Chain
This slide covers KPI dashboard to assess performance of supply chain after implementing effective logistics strategies. It involves details such as delivery status, number of shipments and average delivery time. Deliver an outstanding presentation on the topic using this Dashboard To Analyze Impact Of Warehouse Management Logistics Strategy To Improve Supply Chain. Dispense information and present a thorough explanation of Analyze, System, Management using the slides given. This template can be altered and personalized to fit your needs. It is also available for immediate download. So grab it now.
-
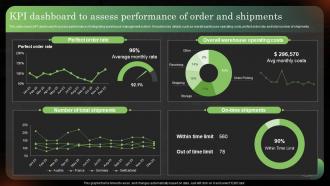 KPI Dashboard To Assess Performance Of Order And Logistics Strategy To Improve Supply Chain
This slide covers KPI dashboard to assess performance of integrating warehouse management system. It involves key details such as overall warehouse operating costs, perfect order rate and total number of shipments. Deliver an outstanding presentation on the topic using this KPI Dashboard To Assess Performance Of Order And Logistics Strategy To Improve Supply Chain. Dispense information and present a thorough explanation of Performance, Operating, Perfect using the slides given. This template can be altered and personalized to fit your needs. It is also available for immediate download. So grab it now.
-
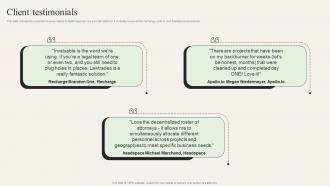 Client Testimonials Lawtraders Investor Funding Elevator Pitch Deck
This slide represents customer reviews related to digital legal service provider platform. It includes reviews from recharge, pollo.io, and headspace executives. Introducing Client Testimonials Lawtraders Investor Funding Elevator Pitch Deck to increase your presentation threshold. Encompassed with Three stages, this template is a great option to educate and entice your audience. Dispence information on Recharge Brandon, Megan Niedermeyer, Michael Marchand, using this template. Grab it now to reap its full benefits.
-
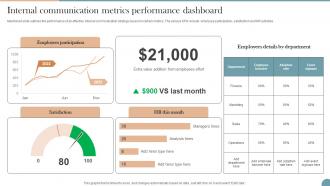 Internal Communication Metrics Performance Workplace Communication Strategy To Improve
Mentioned slide outlines the performance of an effective internal communication strategy based on certain metrics. The various KPIs include employee participation, satisfaction and HR activities. Deliver an outstanding presentation on the topic using this Internal Communication Metrics Performance Workplace Communication Strategy To Improve. Dispense information and present a thorough explanation of Employees, Communication, Performance using the slides given. This template can be altered and personalized to fit your needs. It is also available for immediate download. So grab it now.
-
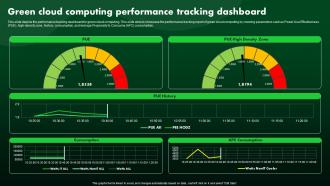 Green Cloud Computing Performance Tracking Dashboard Green IT
This slide depicts the performance tracking dashboard for green cloud computing. This slide aims to showcase the performance tracking report of green cloud computing by covering parameters such as Power Use Effectiveness PUE, high density zone, history, consumption, and Average Propensity to Consume APC consumption. Deliver an outstanding presentation on the topic using this Green Cloud Computing Performance Tracking Dashboard Green IT. Dispense information and present a thorough explanation of Computing, Performance, Tracking using the slides given. This template can be altered and personalized to fit your needs. It is also available for immediate download. So grab it now.
-
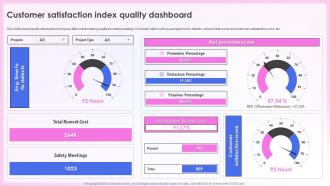 Effective Quality Assurance Strategy Customer Satisfaction Index Quality Dashboard
This slide shows quality standards of company after implementing quality assurance strategy. It include metric such as average time to defects, net promoter score and customer satisfaction score, etc. Present the topic in a bit more detail with this Effective Quality Assurance Strategy Customer Satisfaction Index Quality Dashboard. Use it as a tool for discussion and navigation on Customer Satisfaction, Index Quality Dashboard, Net Promoter Score, Customer Satisfaction Score. This template is free to edit as deemed fit for your organization. Therefore download it now.
-
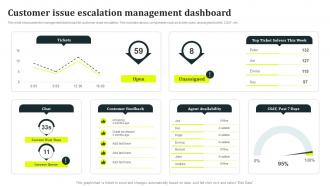 Customer Issue Escalation Management Dashboard
This slide showcases the management dashboard for customer issue escalation. This includes various components such as tickets open, unassigned tickets, CSAT, etc. Introducing our Customer Issue Escalation Management Dashboard set of slides. The topics discussed in these slides are Issue, Customer, Management. This is an immediately available PowerPoint presentation that can be conveniently customized. Download it and convince your audience.
-
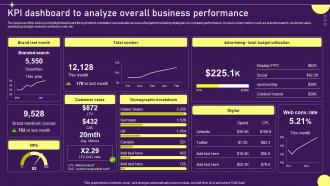 KPI Dashboard To Analyze Overall Developing Targeted Marketing Campaign MKT SS V
The purpose of this slide is to highlight dashboard through which marketers can evaluate success of targeted marketing strategies on company performance. It covers major metrics such as branded search, customer value, advertising budget, website conversion rate, etc. Present the topic in a bit more detail with this KPI Dashboard To Analyze Overall Developing Targeted Marketing Campaign MKT SS V. Use it as a tool for discussion and navigation on Analyze, Business, Performance. This template is free to edit as deemed fit for your organization. Therefore download it now.
-
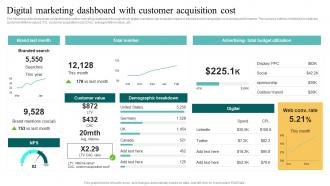 Digital Marketing Dashboard With Complete Introduction To Database MKT SS V
The following slide showcases comprehensive online marketing dashboard through which digital marketers can evaluate impact of advertisement campaigns on business performance. The success metrics mentioned in slide are customer lifetime value LTV, customer acquisition cost CAC, average lifetime value, etc. Deliver an outstanding presentation on the topic using this Digital Marketing Dashboard With Complete Introduction To Database MKT SS V. Dispense information and present a thorough explanation of Budget, Digital, Demographic using the slides given. This template can be altered and personalized to fit your needs. It is also available for immediate download. So grab it now.
-
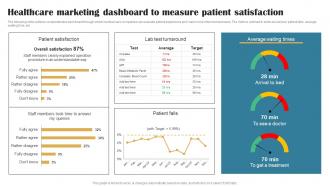 Healthcare Marketing Dashboard To Building Brand In Healthcare Strategy SS V
The following slide outlines comprehensive dashboard through which medical care companies can evaluate patient experience and make more informed decisions. The metrics outlined in slide are lab test, patient falls, average waiting time, etc. Present the topic in a bit more detail with this Healthcare Marketing Dashboard To Building Brand In Healthcare Strategy SS V. Use it as a tool for discussion and navigation on Marketing, Average, Satisfaction. This template is free to edit as deemed fit for your organization. Therefore download it now.
-
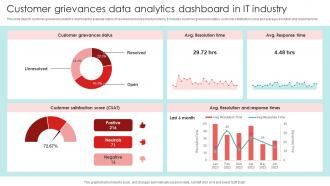 Customer Grievances Data Analytics Dashboard In IT Industry
This slide depicts customer grievances analytics dashboard to evaluate status of resolved and unresolved problems. It includes customer grievances status, customer satisfaction score and average resolution and response time. Introducing our Customer Grievances Data Analytics Dashboard In IT Industry set of slides. The topics discussed in these slides are Customer, Analytics, Industry. This is an immediately available PowerPoint presentation that can be conveniently customized. Download it and convince your audience.
-
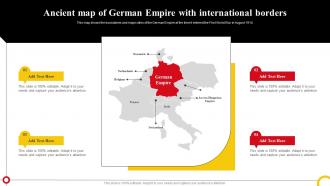 Ancient Map Of German Empire With International Borders
This map shows the boundaries and major cities of the German Empire at the time it entered the First World War in August 1914. Presenting our set of slides with Ancient Map Of German Empire With International Borders. This exhibits information on four stages of the process. This is an easy to edit and innovatively designed PowerPoint template. So download immediately and highlight information on Ancient Map Of German Empire, International Borders.
-
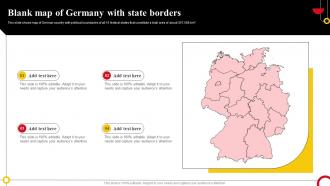 Blank Map Of Germany With State Borders
This slide shows map of German country with political boundaries of all 16 federal states that constitute a total area of about 357,588 km. Introducing our premium set of slides with Blank Map Of Germany With State Borders. Ellicudate the four stages and present information using this PPT slide. This is a completely adaptable PowerPoint template design that can be used to interpret topics like Blank Map Of Germany, State Borders. So download instantly and tailor it with your information.
-
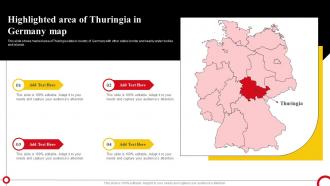 Highlighted Area Of Thuringia In Germany Map
This slide shows marked area of Thuringia state in country of Germany with other states border and nearby water bodies and islands. Introducing our premium set of slides with Highlighted Area Of Thuringia In Germany Map. Ellicudate the four stages and present information using this PPT slide. This is a completely adaptable PowerPoint template design that can be used to interpret topics like Highlighted Area Of Thuringia In, Germany Map. So download instantly and tailor it with your information.
-
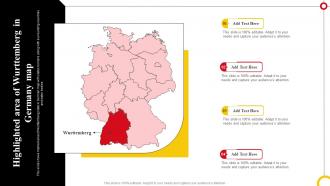 Highlighted Area Of Wurttemberg In Germany Map
This slide shows marked area of Wurttemberg state in German map with states borders along with surrounding countries and water bodies. Presenting our set of slides with Highlighted Area Of Wurttemberg In Germany Map. This exhibits information on four stages of the process. This is an easy to edit and innovatively designed PowerPoint template. So download immediately and highlight information on Highlighted Area, Wurttemberg In Germany Map.
-
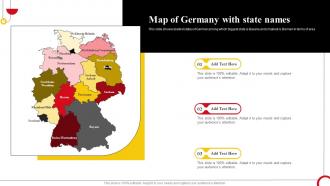 Map Of Germany With State Names
This slide shows labelled states of German among which biggest state is Bavaria and smallest is Bremen in terms of area. Introducing our premium set of slides with Map Of Germany With State Names. Ellicudate the three stages and present information using this PPT slide. This is a completely adaptable PowerPoint template design that can be used to interpret topics like Map Of Germany, State Names. So download instantly and tailor it with your information.
-
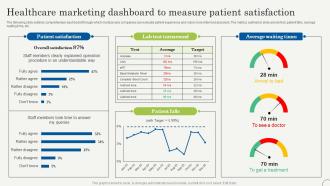 Healthcare Marketing Dashboard To Measure Strategic Plan To Promote Strategy SS V
The following slide outlines comprehensive dashboard through which medical care companies can evaluate patient experience and make more informed decisions. The metrics outlined in slide are lab test, patient falls, average waiting time, etc. Present the topic in a bit more detail with this Healthcare Marketing Dashboard To Measure Strategic Plan To Promote Strategy SS V. Use it as a tool for discussion and navigation on Average, Satisfaction, Measure. This template is free to edit as deemed fit for your organization. Therefore download it now.
-
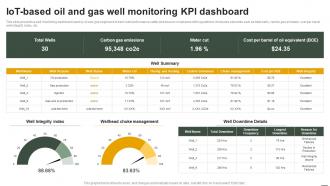 IoT Applications In Oil And Gas IoT Based Oil And Gas Well Monitoring KPI Dashboard IoT SS
This slide presents a well monitoring dashboard used by oil and gas engineers to track well performance safety and ensure compliance with regulations. It includes elements such as total wells, carbon gas emission, cost per barrel well integrity index, etc. Deliver an outstanding presentation on the topic using this IoT Applications In Oil And Gas IoT Based Oil And Gas Well Monitoring KPI Dashboard IoT SS. Dispense information and present a thorough explanation of Well Monitoring Dashboard, Performance Safety, Ensure Compliance With Regulations using the slides given. This template can be altered and personalized to fit your needs. It is also available for immediate download. So grab it now.
-
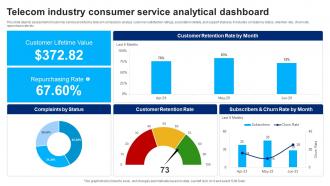 Telecom Industry Consumer Service Analytical Dashboard
This slide depicts assessment of customer service provided by telecom company to analyze customer satisfaction ratings, subscription details, and support statuses. It includes complain by status, retention rate, churn rate, repurchase rate etc. Presenting our well structured Telecom Industry Consumer Service Analytical Dashboard. The topics discussed in this slide are Customer, Repurchasing, Analytical. This is an instantly available PowerPoint presentation that can be edited conveniently. Download it right away and captivate your audience.


