All Flat Designs Dashboards and Measuring Powerpoint Diagram Slide
-
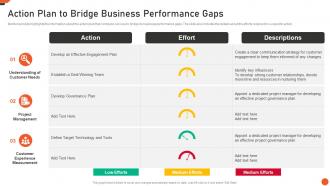 Action Plan To Bridge Business Performance Gaps M And A Playbook
Mentioned slide highlights the information about the action plan that company can use to bridge its business performance gaps. The slide also includes the details about the efforts required for a specific action. Present the topic in a bit more detail with this Action Plan To Bridge Business Performance Gaps M And A Playbook. Use it as a tool for discussion and navigation on Target Technology And Tools, Effective Engagement Plan, Deal Winning Team, Develop Governance Plan. This template is free to edit as deemed fit for your organization. Therefore download it now.
-
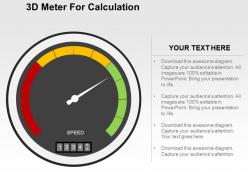 31386021 style essentials 2 dashboard 1 piece powerpoint presentation diagram template slide
We are proud to present our 3d meter for calculation flat powerpoint design. This power point template diagram has been crafted with graphic of 3d meter. This PPT diagram contains the concept of calculation. Use this PPT diagram for business and technology related presentations.
-
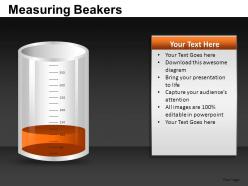 Measuring beakers powerpoint presentation slides db
These high quality, editable pre-designed powerpoint slides and powerpoint templates have been carefully created by our professional team to help you impress your audience. Each graphic in every powerpoint slide is vector based and is 100% editable in powerpoint. Each and every property of any slide - color, size, shading etc can be modified to build an effective powerpoint presentation. Use these slides to convey complex business concepts in a simplified manner. Any text can be entered at any point in the powerpoint slide. Simply DOWNLOAD, TYPE and PRESENT!
-
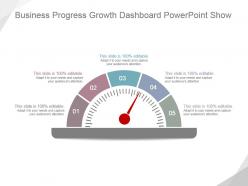 76064910 style essentials 2 dashboard 5 piece powerpoint presentation diagram template slide
Presenting business progress growth dashboard powerpoint show. This is a business progress growth dashboard powerpoint show. This is a five stage process. The stages in this process are business, marketing, dashboard, measure, management.
-
 Reminder ribbon on finger icon
Presenting this set of slides with name Reminder Ribbon On Finger Icon. This is a one stage process. The stages in this process are Reminder, Calendar, Sale Reminder. This is a completely editable PowerPoint presentation and is available for immediate download. Download now and impress your audience.
-
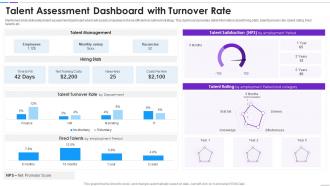 Talent Assessment Dashboard With Turnover Rate
Mentioned slide delineates talent assessment dashboard which will assist companies to frame efficient recruitment strategy. This dashboard provides detail information about hiring stats, talent turnover rate, talent rating, fired talents etc. Introducing our Talent Assessment Dashboard With Turnover Rate set of slides. The topics discussed in these slides are Talent Satisfaction, Knowledge, Effectiveness. This is an immediately available PowerPoint presentation that can be conveniently customized. Download it and convince your audience.
-
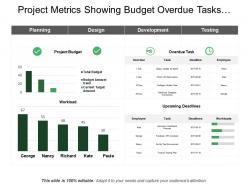 78269850 style essentials 2 financials 4 piece powerpoint presentation diagram infographic slide
Presenting this set of slides with name - Project Metrics Showing Budget Overdue Tasks Workload. This is a four stage process. The stages in this process are Project Kpis, Project Dashboard, Project Metrics.
-
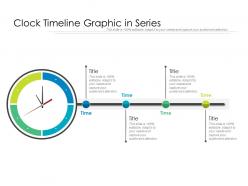 Clock timeline graphic in series
Presenting this set of slides with name Clock Timeline Graphic In Series. This is a one stage process. The stage in this process is Clock Timeline Graphic In Series. This is a completely editable PowerPoint presentation and is available for immediate download. Download now and impress your audience.
-
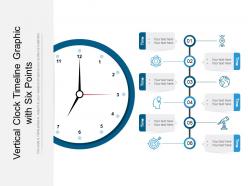 Vertical clock timeline graphic with six points
Presenting this set of slides with name Vertical Clock Timeline Graphic With Six Points. This is a six stage process. The stages in this process are Vertical Clock Timeline Graphic With Six Points. This is a completely editable PowerPoint presentation and is available for immediate download. Download now and impress your audience.
-
 High performance efficiency icon of gauge
Presenting this set of slides with name High Performance Efficiency Icon Of Gauge. This is a three stage process. The stages in this process are High Performance Efficiency Icon Of Gauge. This is a completely editable PowerPoint presentation and is available for immediate download. Download now and impress your audience.
-
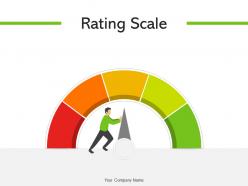 Rating scale communicating qualitative measuring financial survey
If you require a professional template with great design, then this Rating Scale Communicating Qualitative Measuring Financial Survey is an ideal fit for you. Deploy it to enthrall your audience and increase your presentation threshold with the right graphics, images, and structure. Portray your ideas and vision using thirteen slides included in this complete deck. This template is suitable for expert discussion meetings presenting your views on the topic. With a variety of slides having the same thematic representation, this template can be regarded as a complete package. It employs some of the best design practices, so everything is well-structured. Not only this, it responds to all your needs and requirements by quickly adapting itself to the changes you make. This PPT slideshow is available for immediate download in PNG, JPG, and PDF formats, further enhancing its usability. Grab it by clicking the download button.
-
 Digital Marketing Report With Number Of Subscribers
This slide shows the report of digital marketing which represents average flesh reading ease, number of comments per article, story turnaround time with publication, reviewers, conception, submission and editing, etc. Presenting our well structured Digital Marketing Report With Number Of Subscribers. The topics discussed in this slide are Digital Marketing Report With Number Of Subscribers. This is an instantly available PowerPoint presentation that can be edited conveniently. Download it right away and captivate your audience.
-
 Business Reinvention Digital Finance Dashboard Ppt Demonstration
This slide covers transformation dashboard covering various stages of a business along with the budget and risks involved at every stage. Present the topic in a bit more detail with this Business Reinvention Digital Finance Dashboard Ppt Demonstration. Use it as a tool for discussion and navigation on Digital Sales Revenues, Sales Initiatives Benefits Realization, Digital Channels. This template is free to edit as deemed fit for your organization. Therefore download it now.
-
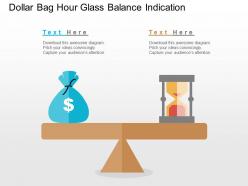 70863782 style essentials 2 financials 2 piece powerpoint presentation diagram infographic slide
Well compatible with Google slides. High resolution template for better visual experience. Option to customize color, text, font and image. Runs smoothly with all software’s. Can be easily converted into PDF or JPG formats. Allow instant downloading of the slide template. Adequate space provided to put in text. Professionally designed by the professional designers. Useful for the individuals from finance, sales and marketing backgrounds.
-
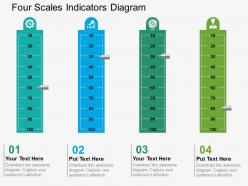 47950044 style layered horizontal 4 piece powerpoint presentation diagram infographic slide
We are proud to present our four scales indicators diagram flat powerpoint design. Graphic of four scales and indicators diagram has been used to craft this power point template diagram. This PPT diagram contains the concept of measurement. Use this PPT diagram for business and marketing related presentations.
-
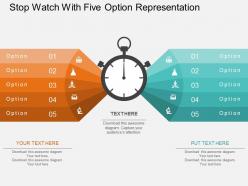 45674859 style linear many-1-many 5 piece powerpoint presentation diagram infographic slide
Completely editable content including fonts, text, colors. Compatible with number of software options. Personalize the presentation with individual company name and logo. Excellence in picture quality even on wide screen output. Easy and quick downloading process. Flexible option for conversion in PDF or JPG formats.
-
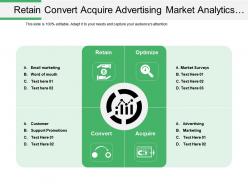 40900178 style cluster mixed 4 piece powerpoint presentation diagram infographic slide
Presenting this set of slides with name - Retain Convert Acquire Advertising Market Analytics Quadrant With Icons. This is a four stage process. The stages in this process are Marketing Analytics, Marketing Performance, Marketing Discovery.
-
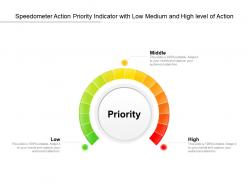 Speedometer action priority indicator with low medium and high level of action
Presenting this set of slides with name Speedometer Action Priority Indicator With Low Medium And High Level Of Action. This is a one stage process. The stages in this process are Action Priority, Pyramid, Level Of Actions. This is a completely editable PowerPoint presentation and is available for immediate download. Download now and impress your audience.
-
 31539327 style circular semi 1 piece powerpoint presentation diagram infographic slide
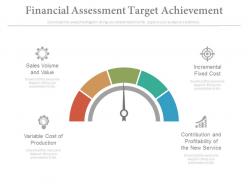
Presenting financial assessment target achievement ppt slides. This is a financial assessment target achievement ppt slides. This is a one stage process. The stages in this process are finance, business, marketing, strategy.
-
 Procurement KPI Performance Benchmark Procurement Spend Analysis Ppt Icons
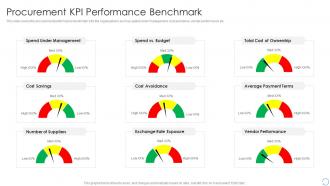
This slide covers the procurement performance benchmarks for the organizations such as spend under management, cost avoidance, vender performance etc. Present the topic in a bit more detail with this Procurement KPI Performance Benchmark Procurement Spend Analysis Ppt Icons. Use it as a tool for discussion and navigation on Management, Cost Savings, Average Payment Terms. This template is free to edit as deemed fit for your organization. Therefore download it now
-
 16274214 style essentials 2 financials 4 piece powerpoint presentation diagram infographic slide
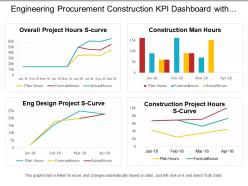
Presenting this set of slides with name - Engineering Procurement Construction Kpi Dashboard With Project Hours S Curve. This is a four stage process. The stages in this process are Engineering, Procurement And Construction, Construction Management, Engineering, Purchasing And Construction .
-
 47103565 style essentials 2 dashboard 3 piece powerpoint presentation diagram infographic slide
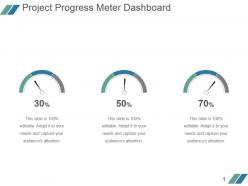
Presenting project progress meter dashboard powerpoint slide designs download. This is a project progress meter dashboard powerpoint slide designs download. This is a three stage process. The stages in this process are business, marketing, dashboard, percentage.
-
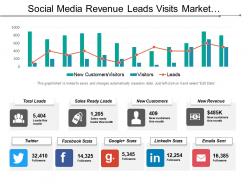 30117359 style essentials 2 financials 3 piece powerpoint presentation diagram infographic slide
Presenting this set of slides with name - Social Media Revenue Leads Visits Market Analytics Table With Graph. This is a three stage process. The stages in this process are Marketing Analytics, Marketing Performance, Marketing Discovery.
-
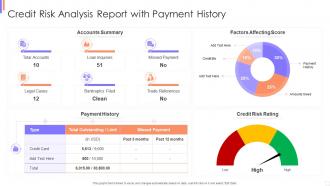 Credit Risk Analysis Report With Payment History
Introducing our Credit Risk Analysis Report With Payment History set of slides. The topics discussed in these slides are Payment History, Credit Risk Rating, Factors Affecting Score. This is an immediately available PowerPoint presentation that can be conveniently customized. Download it and convince your audience.
-
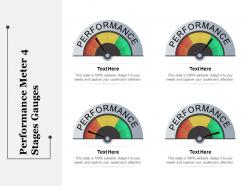 1776903 style essentials 2 dashboard 4 piece powerpoint presentation diagram infographic slide
Get a chance to explore, the performance meter PowerPoint Presentation Slide. This Presentation has been designed by professionals and is fully editable. You can reshape the font size, font type, colors, and even the background. This Template is attainable with Google Slide and can be saved in JPG or PDF format without any nuisance created. Fast download at the click of the button.
-
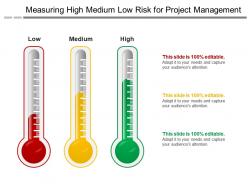 51553210 style variety 3 measure 3 piece powerpoint presentation diagram infographic slide
Presenting this set of slides with name - Measuring High Medium Low Risk For Project Management. This is a threee stage process. The stages in this process are High Medium Low, High Moderate Low, Top Medium Low.
-
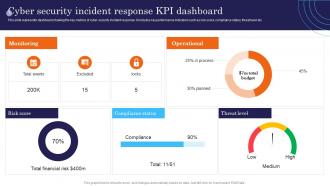 Cyber Security Incident Response KPI Dashboard Incident Response Strategies Deployment
This slide represents dashboard showing the key metrics of cyber security incident response. It includes key performance indicators such as risk score, compliance status, threat level etc. Deliver an outstanding presentation on the topic using this Cyber Security Incident Response KPI Dashboard Incident Response Strategies Deployment. Dispense information and present a thorough explanation of Monitoring, Operational, Score using the slides given. This template can be altered and personalized to fit your needs. It is also available for immediate download. So grab it now.
-
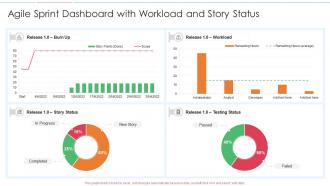 Agile sprint dashboard with workload and story status
Introducing our Agile Sprint Dashboard With Workload And Story Status set of slides. The topics discussed in these slides areAgile Sprint Dashboard With Workload And Story Status With User Workload. This is an immediately available PowerPoint presentation that can be conveniently customized. Download it and convince your audience.
-
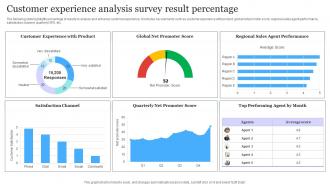 Customer Experience Analysis Survey Result Percentage
The following slide highlights percentage of results to analyze and enhance customer experience. It includes key elements such as customer experience with product, global net promoter score, regional sales agent performance, satisfaction channel, quarterly NPS, etc. Presenting our well structured Customer Experience Analysis Survey Result Percentage. The topics discussed in this slide are Experience, Analysis, Survey. This is an instantly available PowerPoint presentation that can be edited conveniently. Download it right away and captivate your audience.
-
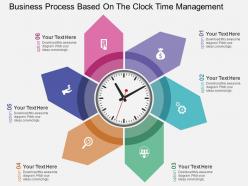 30515273 style circular loop 6 piece powerpoint presentation diagram infographic slide
Fully editable and professional PPT Slide. Inspired by the trending time management tools and techniques. Easily and effortlessly modifiable by any user at any time without even having any specialized knowledge. Compatible with Microsoft office software and the Google slides. Available to be saved in JPG or PDF format. Modify and personalize the presentation by including the company name and logo.
-
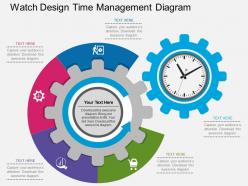 34974550 style variety 1 gears 2 piece powerpoint presentation diagram infographic slide
Presenting new watch design time management diagram flat powerpoint design. This Power Point template diagram has been crafted with graphic of watch diagram. This PPT diagram contains the concept of time management. Use this PPT diagram for finance and business related presentations.
-
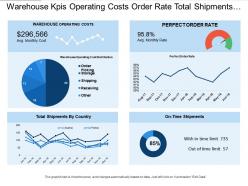 40218787 style essentials 2 financials 4 piece powerpoint presentation diagram infographic slide
Presenting this set of slides with name - Warehouse Kpis Operating Costs Order Rate Total Shipments Country. This is a four stage process. The stages in this process are Warehouse Kpi, Warehouse Dashboard, Warehouse Metrics.
-
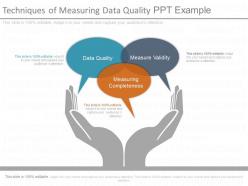 21181993 style essentials 1 quotes 3 piece powerpoint presentation diagram infographic slide
Presenting techniques of measuring data quality ppt example. This is a techniques of measuring data quality ppt example. This is a three stage process. The stages in this process are data quality, measure validity, measure validity.
-
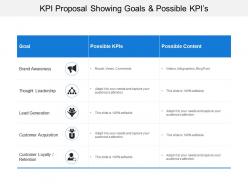 20931032 style essentials 2 compare 3 piece powerpoint presentation diagram infographic slide
Presenting this set of slides with name - Kpi Proposal Showing Goals And Possible Kpis. This is a three stage process. The stages in this process are Kpi Proposal, Kpi Plan, Kpi Scheme.
-
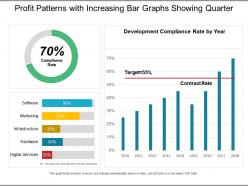 97184548 style essentials 2 financials 3 piece powerpoint presentation diagram infographic slide
Presenting this set of slides with name - Profit Patterns With Increasing Bar Graphs Showing Quarter. This is a three stage process. The stages in this process are Engineering, Procurement And Construction, Construction Management, Engineering, Purchasing And Construction .
-
 Informational dashboard icon used in business
Presenting this set of slides with name Informational Dashboard Icon Used In Business. This is a three stage process. The stages in this process are Informational Dashboard Icon Used In Business. This is a completely editable PowerPoint presentation and is available for immediate download. Download now and impress your audience.
-
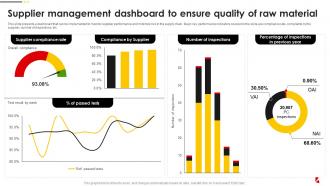 Supplier Management Dashboard To Ensure Food Quality And Safety Management Guide
This slide presents a dashboard that can be implemented to monitor supplier performance and minimize risk in the supply chain. Major key performance indicators covered in the slide are compliance rate, complaints by the supplier, number of inspections, etc. Deliver an outstanding presentation on the topic using this Supplier Management Dashboard To Ensure Food Quality And Safety Management Guide. Dispense information and present a thorough explanation of Ensure, Quality, Material using the slides given. This template can be altered and personalized to fit your needs. It is also available for immediate download. So grab it now.
-
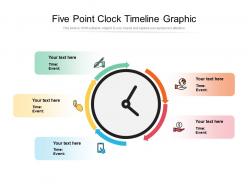 Five point clock timeline graphic
Presenting this set of slides with name Five Point Clock Timeline Graphic. This is a five stage process. The stages in this process are Five Point Clock Timeline Graphic. This is a completely editable PowerPoint presentation and is available for immediate download. Download now and impress your audience.
-
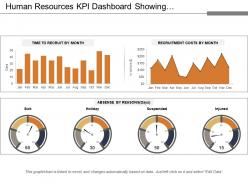 16829057 style essentials 2 financials 3 piece powerpoint presentation diagram infographic slide
Presenting this set of slides with name - Human Resources Kpi Dashboard Showing Recruitment Costs And Absence By Reason. This is a three stage process. The stages in this process are Human Resource, Hrm, Human Capital.
-
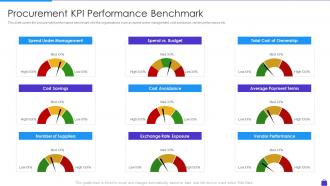 Procurement KPI Performance Benchmark Purchasing Analytics Tools And Techniques
This slide covers the procurement performance benchmarks for the organizations such as spend under management, cost avoidance, vender performance etc. Deliver an outstanding presentation on the topic using this Procurement KPI Performance Benchmark Purchasing Analytics Tools And Techniques. Dispense information and present a thorough explanation of Cost Savings, Vendor Performance, Spend Vs Budget using the slides given. This template can be altered and personalized to fit your needs. It is also available for immediate download. So grab it now.
-
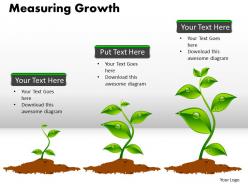 2111299 style concepts 1 growth 1 piece powerpoint presentation diagram infographic slide
High determination PowerPoint visuals. Simplicity of download and can be spared in any organization. Ease of customization and introduction. Good with various programming alternatives accessible both on the web and disconnected. Altogether editable slide plan design. Simplicity of consideration and rejection of slide content at sole tact. Opportunity to customize the slides with organization particular name, logo and trademark. Utilized by deals profile experts, understudies and instructors.
-
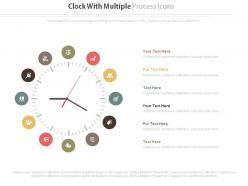 95655442 style variety 3 measure 1 piece powerpoint presentation diagram template slide
Use this PPT slide for the concept of business process control PowerPoint presentations. You can download this enticing PPT template and take advantage of the full version of this slide which includes editing the text, changing the colors according to your liking, watermark gets removed, insert your company's logo and get slides in widescreen.
-
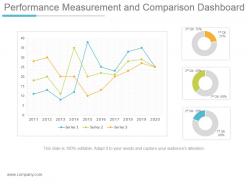 85704424 style essentials 2 financials 3 piece powerpoint presentation diagram infographic slide
Presenting performance measurement and comparison dashboard snapshot ppt design. This is a performance measurement and comparison dashboard ppt design. This is a three stage process. The stages in this process are series, qtr.
-
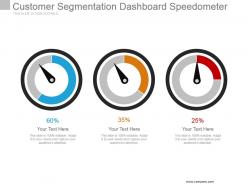 45135755 style essentials 2 dashboard 3 piece powerpoint presentation diagram infographic slide
Presenting customer segmentation dashboard speedometer powerpoint slide. This is a customer segmentation dashboard speedometer powerpoint slide. This is a three stage process. The stages in this process are dashboard, measurement, business, strategy, success.
-
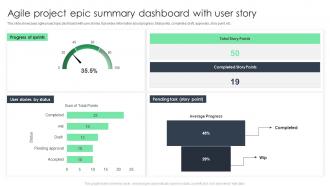 Agile Project Epic Summary Dashboard With User Story
This slide showcases agile project epic dashboard with user stories. It provides information about progress, total points, completed, draft, approvals, story point, etc. Introducing our Agile Project Epic Summary Dashboard With User Story set of slides. The topics discussed in these slides are Progress Of Sprints, Dashboard. This is an immediately available PowerPoint presentation that can be conveniently customized. Download it and convince your audience.
-
 Evaluating Projected Vs Actual Sales Adopting Sales Risks Management Strategies
The following slide depicts the evaluation of existing sales performance to set future standards and determine opportunities for improvement. It mainly includes key performance indicators KPIssuch as pipeline, forecast, attainment, gap etc. Deliver an outstanding presentation on the topic using this Evaluating Projected Vs Actual Sales Adopting Sales Risks Management Strategies. Dispense information and present a thorough explanation of Forecast, Attainment, Gap using the slides given. This template can be altered and personalized to fit your needs. It is also available for immediate download. So grab it now.
-
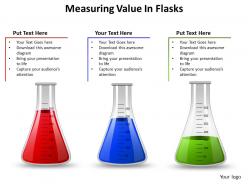 Measuring value in flasks chemistry medical liquid half empty full powerpoint diagram templates graphics 712
These high quality, editable pre-designed measuring value in flasks chemistry medical liquid half empty full powerpoint diagram templates graphics 712 powerpoint slides and powerpoint templates have been carefully created by our professional team to help you impress your audience. Each graphic in every powerpoint slide is vector based and is 100% editable in powerpoint.
-
 24091295 style variety 2 newspaper 1 piece powerpoint presentation diagram infographic slide
Get a chance to go through, newspaper headlines PowerPoint Presentation Slide. This Presentation has been designed by professionals and is fully editable. You can have access to play with the font size, font type, colors, and even the background. This Template is manageable with Google Slide and can be saved in JPG or PDF format without any obstacle created. Fast download at the click of the button.
-
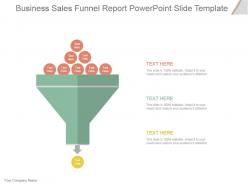 61082414 style layered funnel 3 piece powerpoint presentation diagram infographic slide
Presenting business sales funnel report powerpoint slide template. This is a business sales funnel report powerpoint slide template. This is a three stage process. The stages in this process are business, funnel, strategy, arrow, process.
-
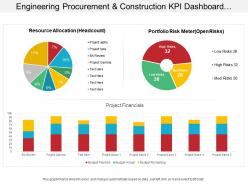 3701286 style essentials 2 financials 3 piece powerpoint presentation diagram template slide
Presenting this set of slides with name - Engineering Procurement And Construction Kpi Dashboard Having Project Financials And Resource Allocation. This is a three stage process. The stages in this process are Engineering, Procurement And Construction, Construction Management, Engineering, Purchasing And Construction .
-
 Countdown day strip showing days left
Presenting this set of slides with name Countdown Day Strip Showing Days Left. This is a two stage process. The stages in this process are Countdown Day Strip Showing Days Left. This is a completely editable PowerPoint presentation and is available for immediate download. Download now and impress your audience.
-
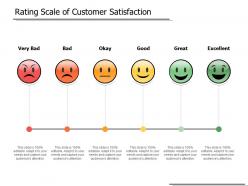 Rating scale of customer satisfaction
Presenting this set of slides with name Rating Scale Of Customer Satisfaction. This is a six stage process. The stages in this process are Product Improvement, Rating Scale, Product Quality. This is a completely editable PowerPoint presentation and is available for immediate download. Download now and impress your audience.
-
 42980308 style variety 3 measure 2 piece powerpoint presentation diagram infographic slide
Presenting this set of slides with name - Business Strategy Corporate Strategy Marketing Penetration Strategy Project Management Cpb. This is an editable two stages graphic that deals with topics like Business Strategy Corporate Strategy, Marketing Penetration Strategy, Project Management to help convey your message better graphically. This product is a premium product available for immediate download, and is 100 percent editable in Powerpoint. Download this now and use it in your presentations to impress your audience.
-
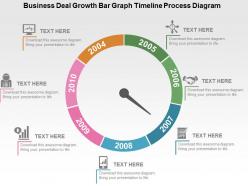 21122025 style circular loop 7 piece powerpoint presentation diagram infographic slide
We are proud to present our business deal growth bar graph timeline process diagram. Graphic of bar graph timeline diagram has been used to craft this power point template diagram. This PPT diagram contains the concept of business deal and growth . This PPT diagram can be used for business and marketing related presentations.
-
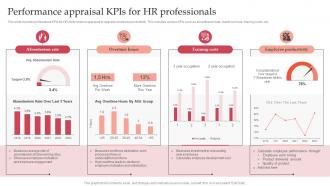 Performance Appraisal KPIs For HR Professionals
This slide includes professional KPIs for HR performance appraisal to upgrade employee productivity. This includes various KPIs such as absenteeism rate, overtime hours, training costs, etc. Presenting our well structured Performance Appraisal KPIs For HR Professionals. The topics discussed in this slide are Performance, Appraisal, Professionals. This is an instantly available PowerPoint presentation that can be edited conveniently. Download it right away and captivate your audience.
-
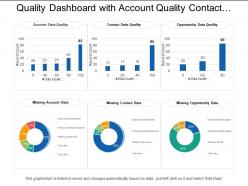 47572750 style essentials 2 financials 6 piece powerpoint presentation diagram infographic slide
Presenting this set of slides with name - Quality Dashboard Snapshot With Account Quality Contact Data Missing Account Data. This is a six stage process. The stages in this process are Quality Dashboard, Quality Kpi, Quality Metircs.
-
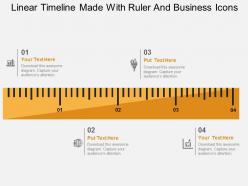 45466972 style linear single 4 piece powerpoint presentation diagram infographic slide
We are proud to present our linear timeline made with ruler and business icons flat powerpoint design. Graphic of linear timeline and business icons has been used to craft this power point template diagram. This PPT diagram contains the concept of timeline formation . Use this PPT diagram for business and marketing related presentations.
-
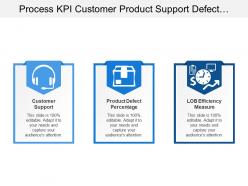 62070819 style layered horizontal 3 piece powerpoint presentation diagram infographic slide
Presenting this set of slides with name - Process Kpi Customer Product Support Defect Lob Measure. This is a three stage process. The stages in this process are Kpi, Dashboard, Metrics.
-
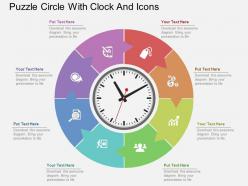 38088209 style essentials 1 agenda 8 piece powerpoint presentation diagram infographic slide
Presenting fr puzzle circle with clock and icons flat powerpoint design. Graphic puzzle circle with clock and icons has been used to design this power point template diagram. This PPT diagram contains the concept of time management .Use this PPT diagram for business and marketing related presentations.
-
 Pay reminder calendar icon
Presenting this set of slides with name Pay Reminder Calendar Icon. This is a one stage process. The stages in this process are Reminder, Calendar, Sale Reminder. This is a completely editable PowerPoint presentation and is available for immediate download. Download now and impress your audience.


