All Flat Designs Dashboards and Measuring Powerpoint Diagram Slide
-
 60384554 style essentials 2 dashboard 3 piece powerpoint presentation diagram infographic slide
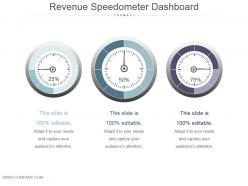
Presenting revenue speedometer dashboard Snapshot ppt diagrams. This is a revenue speedometer dashboard ppt diagrams. This is a three stage process. The stages in this process are business, marketing, success, dashboard, percentage.
-
 48683151 style layered funnel 3 piece powerpoint presentation diagram infographic slide
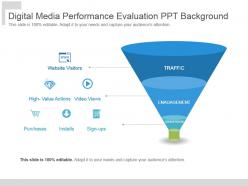
Presenting digital media performance evaluation ppt background. This is a digital media performance evaluation ppt background. This is a three stage process. The stages in this process are traffic, engagement, conversion.
-
 2211848 style concepts 1 strength 1 piece powerpoint presentation diagram infographic slide
This template is skillfully designed and is completely editable to suit all the needs and requirements of the user. The color of the font, its size, style, and all other elements can be customized according to the user's desire The text in the PPT placeholder can be replaced with the desired information making this template highly flexible and adaptable as well. This template is also compatible with various Microsoft versions and formats like Google Slides, JPG, PDF, etc so the user will face no issue in saving it in the format of his choice.
-
 64397942 style essentials 2 compare 6 piece powerpoint presentation diagram infographic slide
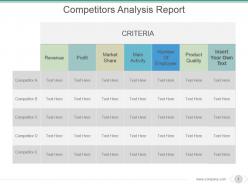
Presenting competitors analysis report powerpoint slide background picture. This is a competitors analysis report powerpoint slide background picture. This is a seven stage process. The stages in this process are revenue, profit, market share, main activity, number of employee, product quality, insert your own text.
-
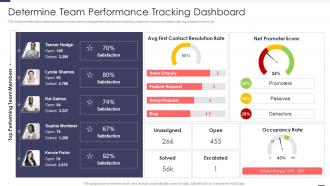 Determine Team Performance Tracking Dashboard Improved Workforce Effectiveness Structure
This slide provides information about team performance management dashboard by tracking customer concern resolution rate, top people involved, etc. Deliver an outstanding presentation on the topic using this Determine Team Performance Tracking Dashboard Improved Workforce Effectiveness Structure. Dispense information and present a thorough explanation of Satisfaction, Promoters, Passives using the slides given. This template can be altered and personalized to fit your needs. It is also available for immediate download. So grab it now.
-
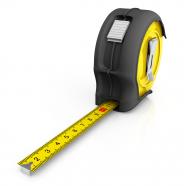 3d measuring tape for distance measurement stock photo
We are proud to present our 3d measuring tape for distance measurement stock photo. This image is in .jpg format and is available in size 2000x2000 This image is crafted with graphic of 3d measuring tape. This image displays the theme and concept of engineering measurement. Show distance measurement in any engineering and dimension related presentations using this image.
-
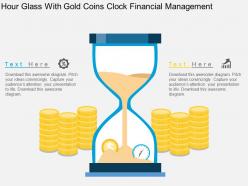 57291332 style essentials 2 financials 2 piece powerpoint presentation diagram infographic slide
We are proud to present our hour glass with gold coins clock financial management flat powerpoint design. Graphic of hour glass with gold coins and clock has been used to design this power point template diagram. This PPT diagram contains the concept of financial management. Use this PPT diagram for business and marketing related presentations.
-
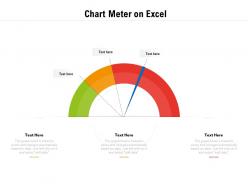 Chart meter on excel
Presenting this set of slides with name Chart Meter On Excel. This is a one stage process. The stages in this process are Chart Meter On Excel. This is a completely editable PowerPoint presentation and is available for immediate download. Download now and impress your audience.
-
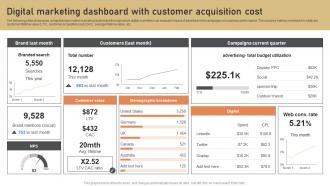 Digital Marketing Dashboard With Customer Low Budget Marketing Techniques Strategy SS V
The following slide showcases comprehensive online marketing dashboard through which digital marketers can evaluate impact of advertisement campaigns on business performance. The success metrics mentioned in slide are customer lifetime value LTV, customer acquisition cost CAC, average lifetime value, etc. Present the topic in a bit more detail with this Digital Marketing Dashboard With Customer Low Budget Marketing Techniques Strategy SS V. Use it as a tool for discussion and navigation on Digital, Customer, Cost. This template is free to edit as deemed fit for your organization. Therefore download it now.
-
 99373965 style circular loop 5 piece powerpoint presentation diagram infographic slide
We are proud to present our flower petal with clock time management business process flat powerpoint design. Graphic of five staged flower petal and clock has been used to design this power point template diagram. This PPT diagram contains the concept of business process and time management representation. Use this PPT diagram for business and marketing related presentations.
-
 Self performance tracking meter for employees icon
Presenting this set of slides with name Self Performance Tracking Meter For Employees Icon. This is a one stage process. The stages in this process is Self Performance Tracking Meter For Employees Icon. This is a completely editable PowerPoint presentation and is available for immediate download. Download now and impress your audience.
-
 Time saving icon with hourglass and arrows
Presenting this set of slides with name Time Saving Icon With Hourglass And Arrows. This is a three stage process. The stages in this process are Time Saving Icon With Hourglass And Arrows. This is a completely editable PowerPoint presentation and is available for immediate download. Download now and impress your audience.
-
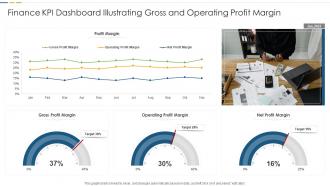 Finance KPI Dashboard Illustrating Gross And Operating Profit Margin
Introducing our Finance KPI Dashboard Illustrating Gross And Operating Profit Margin set of slides. The topics discussed in these slides are Gross Profit Margin, Operating Profit Margin, Net Profit Margin. This is an immediately available PowerPoint presentation that can be conveniently customized. Download it and convince your audience.
-
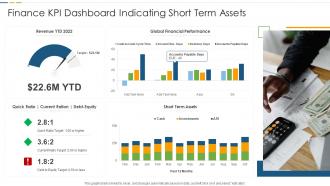 Finance KPI Dashboard Indicating Short Term Assets
Presenting our well structured Finance KPI Dashboard Indicating Short Term Assets. The topics discussed in this slide are Global Financial Performance, Quick Ratio, Short Term Assets. This is an instantly available PowerPoint presentation that can be edited conveniently. Download it right away and captivate your audience.
-
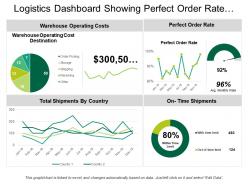 60994626 style division pie 4 piece powerpoint presentation diagram infographic slide
Presenting Logistics Dashboard Showing Perfect Order Rate And On Time Shipments PPT slide. The on-time shipments dashboard PowerPoint template designed professionally by the team of SlideTeam to present the record of on time delivery to clients and investors. The different icons such as pie chart, ring, line chart and many other which include text in the perfect order rate dashboard slide are customizable in PowerPoint. A user can illustrate the desired values as the graphical dashboard template get linked with Excel Sheet and it is also compatible with Google Slide. A user can do alteration in the font size, font type, color and dimensions of the line and pie chart to present the desired delivery time.
-
 14524023 style variety 2 newspaper 1 piece powerpoint presentation diagram infographic slide
Grab an opportunity to save, the newspaper headlines PowerPoint Presentation Slide. This Presentation has been designed under the keen supervision of professionals and is fully editable. You can personalize the font size, font type, colors, and even the background. This Template is amiable with Google Slide and can be saved in JPG or PDF format without any real time chaos created during the process. Fast download at the click of the button.
-
 Icon of cost savings performance management dashboard
Presenting our set of slides with name Icon Of Cost Savings Performance Management Dashboard. This exhibits information on one stages of the process. This is an easy-to-edit and innovatively designed PowerPoint template. So download immediately and highlight information on Icon Of Cost Savings Performance Management Dashboard.
-
 Morning to evening clock timeline graphic
Presenting this set of slides with name Morning To Evening Clock Timeline Graphic. This is a ten stage process. The stages in this process are Morning To Evening Clock Timeline Graphic. This is a completely editable PowerPoint presentation and is available for immediate download. Download now and impress your audience.
-
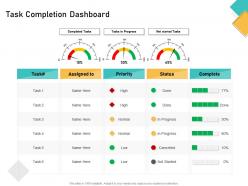 How visually map content strategy brand task completion dashboard ppt templates
Present the topic in a bit more detail with this How Visually Map Content Strategy Brand Task Completion Dashboard Ppt Templates. Use it as a tool for discussion and navigation on Task Completion Dashboard. This template is free to edit as deemed fit for your organization. Therefore download it now.
-
 76630851 style linear opposition 4 piece powerpoint presentation diagram infographic slide
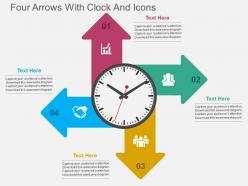
Presenting kr four arrows with clock and icons flat powerpoint design. Four arrows with clock has been used to design this power point template diagram. This PPT diagram contains the concept of time and process management. Use this PPT diagram for business and production related presentations.
-
 620858 style concepts 1 opportunity 3 piece powerpoint presentation diagram infographic slide
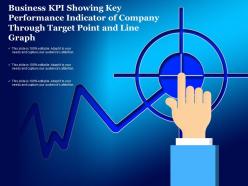
Presenting this set of slides with name - Business Kpi Showing Key Performance Indicator Of Company Through Target Point And Line Graph. This is a three stage process. The stages in this process are Business Kpi, Business Dashboard, Business Metrics.
-
 15869134 style essentials 2 financials 4 piece powerpoint presentation diagram infographic slide
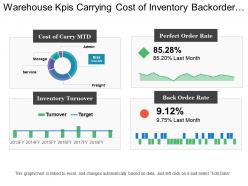
Presenting this set of slides with name - Warehouse Kpis Carrying Cost Of Inventory Backorder Rate Inventory Turnover. This is a four stage process. The stages in this process are Warehouse Kpi, Warehouse Dashboard, Warehouse Metrics.
-
 18298948 style division donut 4 piece powerpoint presentation diagram infographic slide
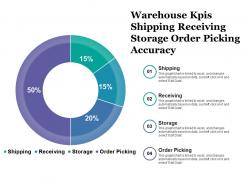
Presenting this set of slides with name - Warehouse Kpis Shipping Receiving Storage Order Picking Accuracy. This is a four stage process. The stages in this process are Warehouse Kpi, Warehouse Dashboard, Warehouse Metrics.
-
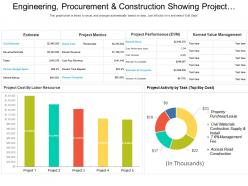 39882778 style essentials 2 financials 3 piece powerpoint presentation diagram infographic slide
Presenting this set of slides with name - Engineering Procurement And Construction Showing Project Metrics And Activity. This is a three stage process. The stages in this process are Engineering, Procurement And Construction, Construction Management, Engineering, Purchasing And Construction .
-
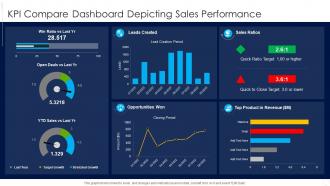 KPI Compare Dashboard Depicting Sales Performance
Presenting our well structured KPI Compare Dashboard Depicting Sales Performance. The topics discussed in this slide are Opportunities Won, Product In Revenue, Sales Ratios. This is an instantly available PowerPoint presentation that can be edited conveniently. Download it right away and captivate your audience.
-
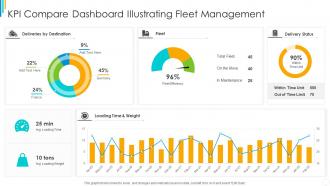 KPI Compare Dashboard Illustrating Fleet Management
Presenting our well structured KPI Compare Dashboard Illustrating Fleet Management. The topics discussed in this slide are Delivery Status, Loading Time And Weight, Deliveries By Destination. This is an instantly available PowerPoint presentation that can be edited conveniently. Download it right away and captivate your audience.
-
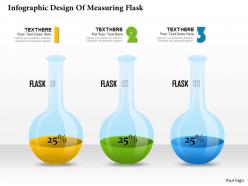 29592268 style layered horizontal 3 piece powerpoint presentation diagram infographic slide
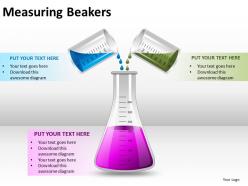
We are proud to present our 0314 business ppt diagram infographic design of measuring flask powerpoint template. Use Our 0314 Business Ppt Diagram Infographic Design Of Measuring Flask Powerpoint Template Power Point Templates To Steer Your Racing Mind. Hit The Right Buttons And Spur On Your Audience. Embellish Your Thoughts By Using Our Measuring Power Point Templates. They Will Help You Illustrate The Brilliance Of Your Ideas.
-
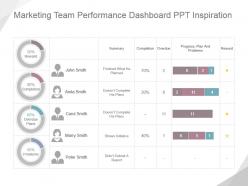 56585420 style essentials 2 dashboard 4 piece powerpoint presentation diagram infographic slide
Presenting marketing team performance dashboard ppt inspiration. This is a marketing team performance dashboard ppt inspiration. This is a four stage process. The stages in this process are peter smith, marry smith, carol smith, anita smith, peter smith, reward, completion, overdue plans, problems, summary, finished what he planned, doesnt complete his plans, shows initiative, didnt submit a report, overdue, progress, plan and problems, reward.
-
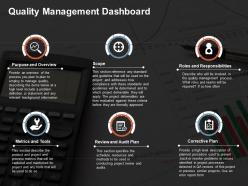 95259552 style essentials 2 dashboard 6 piece powerpoint presentation diagram infographic slide
Presenting quality management dashboard powerpoint graphics. This is a quality management dashboard powerpoint graphics. This is a six stage process. The stages in this process are purpose and overview, scope, roles and responsibilities, metrics and tools, review and audit plan, corrective plan.
-
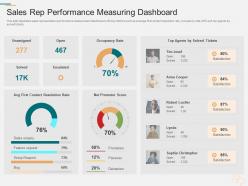 Sales rep performance measuring dashboard marketing planning and segmentation strategy
This slide illustrates sales representative performance measurement dashboard with key metrics such as average first contact resolution rate, occupancy rate, NPS and top agents by solved tickets. Present the topic in a bit more detail with this Sales Rep Performance Measuring Dashboard Marketing Planning And Segmentation Strategy. Use it as a tool for discussion and navigation on Sales Rep Performance Measuring Dashboard. This template is free to edit as deemed fit for your organization. Therefore download it now.
-
 Who what when for any project description
Presenting this set of slides with name Who What When For Any Project Description. This is a three stage process. The stages in this process are Who What When For Any Project Description. This is a completely editable PowerPoint presentation and is available for immediate download. Download now and impress your audience.
-
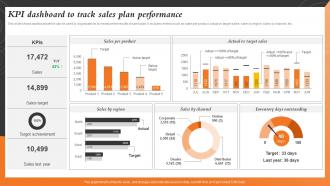 KPI Dashboard To Track Sales Plan Sales And Marketing Alignment For Business Strategy SS V
This slide shows dashboard which can be used by organizations to measure the results of sales plan. It includes metrics such as sales per product, actual vs target sales, sales by region, sales by channel, etc. Deliver an outstanding presentation on the topic using this KPI Dashboard To Track Sales Plan Sales And Marketing Alignment For Business Strategy SS V. Dispense information and present a thorough explanation of Product, Target, Performance using the slides given. This template can be altered and personalized to fit your needs. It is also available for immediate download. So grab it now.
-
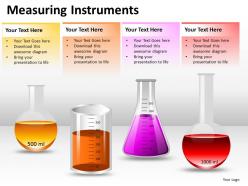 85543408 style concepts 1 strength 1 piece powerpoint presentation diagram infographic slide
This template is skillfully designed and is completely editable to suit all the needs and requirements of the user. The color of the font, its size, style, and all other elements can be customized according to the user's desire The text in the PPT placeholder can be replaced with the desired information making this template highly flexible and adaptable as well. This template is also compatible with various Microsoft versions and formats like Google Slides, JPG, PDF, etc so the user will face no issue in saving it in the format of his choice.
-
 84637928 style circular loop 8 piece powerpoint presentation diagram infographic slide
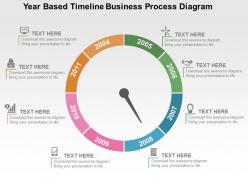
We are proud to present our year based timeline business process diagram flat powerpoint design. This power point template diagram has been crafted with graphic of year based timeline. This PPT diagram contains the concept of business process representation. This PPT diagram can be used for business and marketing presentations.
-
 72448824 style layered funnel 4 piece powerpoint presentation diagram infographic slide
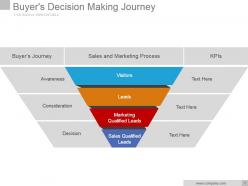
Presenting buyers decision making journey powerpoint slide backgrounds. This is a buyers decision making journey powerpoint slide backgrounds. This is a four stage process. The stages in this process are visitors, leads, marketing qualified leads, sales qualified leads, decision, consideration, awareness, sales and marketing process, buyers journey.
-
 Four steps for assessment in risk review
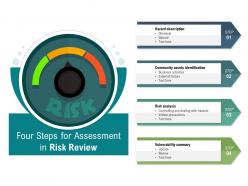
Presenting this set of slides with name Four Steps For Assessment In Risk Review. This is a four stage process. The stages in this process are Risk Analysis, Vulnerability, Hazard Description. This is a completely editable PowerPoint presentation and is available for immediate download. Download now and impress your audience.
-
 Kpi for enterprise performance management system
Introducing our premium set of slides with KPI For Enterprise Performance Management System. Elucidate the three stages and present information using this PPT slide. This is a completely adaptable PowerPoint template design that can be used to interpret topics like KPI For Enterprise Performance Management System. So download instantly and tailor it with your information.
-
 Evaluating Projected Vs Actual Sales Implementing Sales Risk Management Process
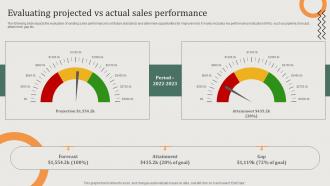
The following slide depicts the evaluation of existing sales performance to set future standards and determine opportunities for improvement. It mainly includes key performance indicators KPIs such as pipeline, forecast, attainment, gap etc. Present the topic in a bit more detail with this Evaluating Projected Vs Actual Sales Implementing Sales Risk Management Process. Use it as a tool for discussion and navigation on Forecast, Attainment, Gap. This template is free to edit as deemed fit for your organization. Therefore download it now.
-
 KPI Dashboard To Track Overall Employee Effective Workplace Culture Strategy SS V
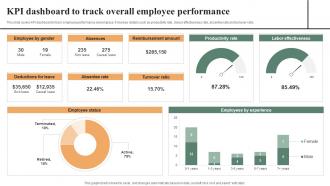
This slide covers KPI dashboard to track employee performance at workplace. It involves details such as productivity rate, labour effectiveness rate, absentee rate and turnover ratio. Deliver an outstanding presentation on the topic using this KPI Dashboard To Track Overall Employee Effective Workplace Culture Strategy SS V. Dispense information and present a thorough explanation of Employee, Deductions, Reimbursement using the slides given. This template can be altered and personalized to fit your needs. It is also available for immediate download. So grab it now.
-
 20295388 style circular hub-spoke 6 piece powerpoint presentation diagram infographic slide
Presenting bd circle of watch infographics with icons flat powerpoint design. This Power Point template diagram has been crafted with graphic of circle made of watch and info graphics diagram. This PPT diagram contains the concept of time management. Use this PPT diagram for business and management related presentations.
-
 51930459 style essentials 2 compare 5 piece powerpoint presentation diagram infographic slide
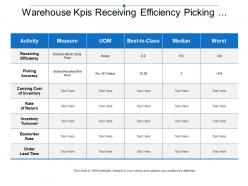
Presenting this set of slides with name - Warehouse Kpis Receiving Efficiency Picking Accuracy Carrying Inventory. This is a five stage process. The stages in this process are Warehouse Kpi, Warehouse Dashboard, Warehouse Metrics.
-
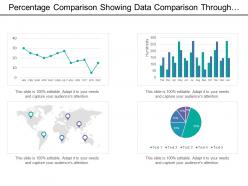 31775080 style essentials 2 financials 4 piece powerpoint presentation diagram infographic slide
Presenting this set of slides with name - Percentage Comparison Showing Data Comparison Through Bar Graph And Line Graph. This is a four stage process. The stages in this process are Percentage Comparison, Percentage Compare, Percentage Balancing.
-
 54657061 style variety 3 measure 2 piece powerpoint presentation diagram infographic slide
We are proud to present our industrial measuring tape flat powerpoint design. Graphic of industrial measuring tape has been used to craft this power point template diagram. This PPT diagram contains the concept of measurement. Use this PPT diagram for business and marketing related presentation.
-
 99335522 style concepts 1 leadership 4 piece powerpoint presentation diagram infographic slide
We are proud to present our et stopwatchs pendulums with one red for leadership indication flat powerpoint design. This power point template diagram has been crafted with graphic of stopwatch and pendulums. This PPT diagram contains the concept of leadership indication. Use this PPT diagram for business and sales related presentations.
-
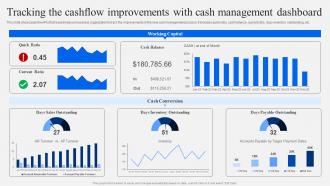 Tracking The Cashflow Improvements With Cash Management Dashboard Strategic Financial Planning
This slide showcases the KPIs that would help our business organization to track the improvements in the new cash management process. It includes quick ratio, cash balance, current ratio, days inventory outstanding, etc. Present the topic in a bit more detail with this Tracking The Cashflow Improvements With Cash Management Dashboard Strategic Financial Planning. Use it as a tool for discussion and navigation on Quick Ratio, Current Ratio, Cash Balance. This template is free to edit as deemed fit for your organization. Therefore download it now.
-
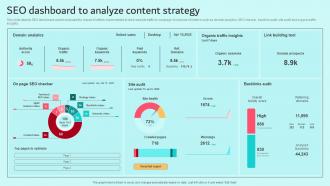 SEO Dashboard To Analyze Content Strategy Brand Content Strategy Guide MKT SS V
This slide depicts SEO dashboard used to evaluate the impact of efforts implemented to drive website traffic to webpage. It consists of metrics such as domain analytics, SEO checker, backlink audit, site audit and organic traffic insights. Deliver an outstanding presentation on the topic using this SEO Dashboard To Analyze Content Strategy Brand Content Strategy Guide MKT SS V. Dispense information and present a thorough explanation of Analytics, Strategy, Tool using the slides given. This template can be altered and personalized to fit your needs. It is also available for immediate download. So grab it now.
-
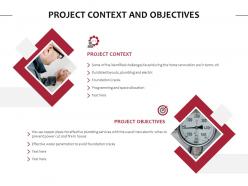 Project context and objectives ppt powerpoint presentation slides
Presenting this set of slides with name Project Context And Objectives Ppt Powerpoint Presentation Slides. This is a two stage process. The stages in this process are Business, Management, Planning, Strategy, Marketing. This is a completely editable PowerPoint presentation and is available for immediate download. Download now and impress your audience.
-
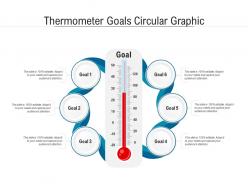 Thermometer goals circular graphic
Presenting this set of slides with name Thermometer Goals Circular Graphic. This is a six stage process. The stages in this process are Thermometer Goals Circular Graphic. This is a completely editable PowerPoint presentation and is available for immediate download. Download now and impress your audience.
-
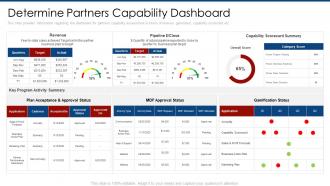 Determine partners capability dashboard partner marketing plan ppt summary
This slide provides information regarding the dashboard for partners capability assessment in terms of revenue generated, capability scorecard etc. Deliver an outstanding presentation on the topic using this Determine Partners Capability Dashboard Partner Marketing Plan Ppt Summary. Dispense information and present a thorough explanation of Revenue, Gamification Status, Approval Status using the slides given. This template can be altered and personalized to fit your needs. It is also available for immediate download. So grab it now.
-
 Disaster Risk Severity Assessment Icon
Introducing our premium set of slides with Disaster Risk Severity Assessment Icon. Ellicudate the four stages and present information using this PPT slide. This is a completely adaptable PowerPoint template design that can be used to interpret topics like Disaster Risk Severity, Assessment Icon. So download instantly and tailor it with your information.
-
 89546168 style layered horizontal 3 piece powerpoint presentation diagram infographic slide
We are proud to present our different time zone clocks flat powerpoint design. Explain the concept of time management for different zones with this unique PPT diagram. This PPT diagram contains the graphic of clocks. Use this PPT diagram for business and management related presentations.
-
 83014165 style concepts 1 growth 5 piece powerpoint presentation diagram infographic slide
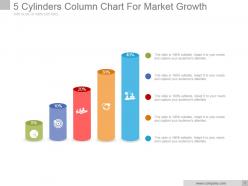
Presenting 5 cylinders column chart for market growth powerpoint templates. This is a 5 cylinders column chart for market growth powerpoint templates. This is a five stage process. The stages in this process are business, marketing, icons, growth, finance.
-
 80819999 style essentials 2 financials 4 piece powerpoint presentation diagram infographic slide
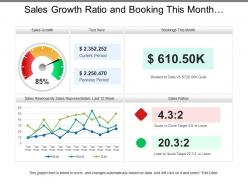
Presenting this set of slides with name - Sales Growth Ratio And Booking This Month Dashboard. This is a four stage process. The stages in this process are Sales Dashboard, Sales Kpis, Sales Performance.
-
 Smart watch illustration wearable technology infographic template
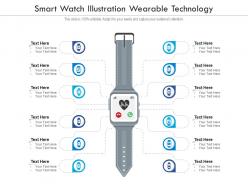
This is a single slide titled Smart Watch Illustration Wearable Technology Infographic Template. It is crafted using high quality vector based visuals that are 100 percent editable and available for immediate download in standard and widescreen aspect ratios.
-
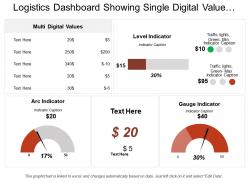 7953255 style essentials 2 dashboard 3 piece powerpoint presentation diagram infographic slide
Presenting Logistics Dashboard Showing Single Digital Value Arc Indicator PPT slide. The sales growth digital value PowerPoint template designed professionally by the team of SlideTeam to present formulation as well as execution of business finance strategy. The different icons such as arc indicator, dot symbol and many other, as well as text in the sale growth dashboard slide. This slide is customizable in PowerPoint and can help you in sharing the values in digital format. The logistics digital dashboard slide is compatible with Google Slide. A user can make changes in the font size, font type, color and dimensions of the different icons to present the desired digital values.
-
 86559284 style essentials 2 financials 3 piece powerpoint presentation diagram infographic slide
Presenting Logistics Dashboard With Revenue Breakdown And Time To Market PPT slide. The revenue breakdown dashboard PowerPoint template designed by the professional team of SlideTeam to present the entire plan to clients as well as investors. The bar chart, pie charts, text and image in time to market dashboard slide are customizable in PowerPoint and can help you in sharing the market sale target. The logistics performance dashboard slide is compatible with Google Slide which makes easy for a presenter to present business financial statistics. A user may do changes in the font size, font type, color and dimensions of the charts to present the desired sales value.
-
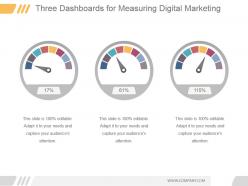 69626100 style essentials 2 dashboard 3 piece powerpoint presentation diagram infographic slide
Presenting three dashboards for measuring digital marketing ppt summary. This is a three dashboards for measuring digital marketing ppt summary. This is a three stage process. The stages in this process are dashboard, measuring, business, marketing, percentage.
-
 1434562 style technology 1 servers 4 piece powerpoint presentation diagram infographic slide
Presenting this set of slides with name - Kpi Icon With Laptop Screen. This is a four stage process. The stages in this process are Metrics Icon, Kpi Icon, Statistics Icon.
-
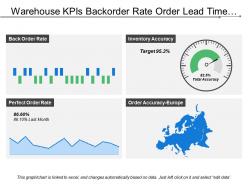 26030290 style essentials 2 financials 4 piece powerpoint presentation diagram infographic slide
Presenting this set of slides with name - Warehouse Kpis Backorder Rate Order Lead Time Inventory Accuracy. This is a four stage process. The stages in this process are Warehouse Kpi, Warehouse Dashboard, Warehouse Metrics.
-
 Icon represent timer with calendar
Presenting this set of slides with name Icon Represent Timer With Calendar. This is a one stage process. The stage in this process is Icon Represent Timer With Calendar. This is a completely editable PowerPoint presentation and is available for immediate download. Download now and impress your audience.


