All Illustrations Decision Making Powerpoint Diagram Slide
-
 Healthcare Cyber Security Compliance Data Encryption Illustration
This coloured PowerPoint Illustration is designed to represent healthcare cyber security. It features a blue shield with a white cross in the center, symbolizing protection against malicious cyber threats. It is a perfect visual aid for any presentation on the importance of cyber security in healthcare.
-
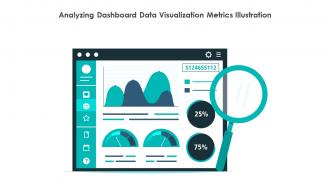 Analyzing Dashboard Data Visualization Metrics Illustration
This colored PowerPoint icon is perfect for visualizing data and analyzing dashboard. It features a graph, charts, and other elements to help you track and analyze data quickly and easily. Perfect for presentations and reports.
-
 Money Finance Billing Banking Transaction Illustration
This coloured PowerPoint Illustration is perfect for presentations on finance transactions. It features a green and blue colour scheme and is a great visual aid to help explain complex financial concepts. It is an eye-catching and professional design that will make your presentations stand out.
-
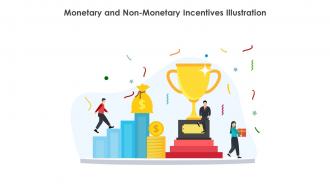 Monetary And Non Monetary Incentives Illustration
A colourful PowerPoint Illustration depicting Monetary and Non Monetary Incentives, ideal for use in presentations, reports and other documents. It is a perfect visual aid to explain the concept of rewards and motivation. The Illustration is designed to help illustrate the differences between the two types of incentives.
-
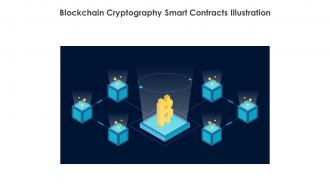 Blockchain Cryptography Smart Contracts Illustration
This coloured PowerPoint Illustration is a visual representation of blockchain technology. It features a vibrant blue and green colour palette, with a sleek and modern design. It is perfect for presentations and projects related to blockchain, cryptocurrency, and digital finance.
-
 Organization Transformation Management Process Illustration
This coloured powerpoint Illustration is the perfect visual aid for presentations on Organization Transformation Management. It is a vibrant and eye-catching representation of the concept, and is sure to make your presentation stand out. The Illustration is available in multiple colours, making it easy to match your presentations theme.
-
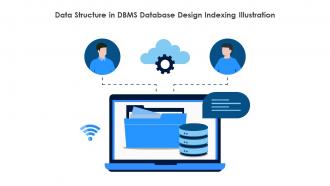 Data Structure In DBMS Database Design Indexing Illustration
Data Structure in DBMS PowerPoint Icon A colourful icon depicting a data structure in DBMS. Perfect for presentations, slideshows, and reports. Ideal for students, professionals, and teachers.
-
 Implementation Process Management Data Governance Illustration
This coloured powerpoint Illustration is the perfect visual representation of the implementation process. It features a series of steps with arrows to show the order of operations and is a great way to illustrate the process to any audience.
-
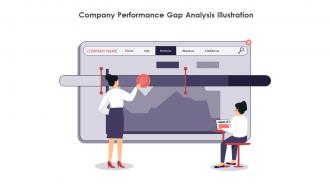 Company Performance Gap Analysis Illustration
This colourful PowerPoint Illustration is an eye-catching visual representation of company performance. Its perfect for presentations and reports, and can be used to illustrate key performance indicators.
-
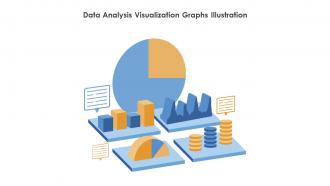 Data Analysis Visualization Graphs Illustration
Brightly powerpoint Illustration with a bar graph to represent data visualization. Perfect for presentations, reports, and other documents to illustrate data points and trends.
-
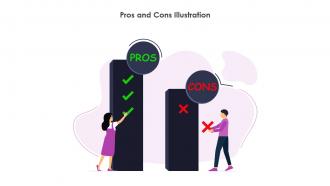 Pros And Cons Illustration
This PowerPoint Illustration is a visual representation of the pros and cons of a particular topic. It features a bright and colourful illustration to help viewers quickly understand the positives and negatives of the subject. Perfect for presentations and reports.
-
 Treasury Finances Budget Bank Illustration
A bright coloured PowerPoint Illustration depicting a Treasury symbol. Perfect for presentations, documents and other business related projects. Ideal for financial professionals and anyone looking to add a professional touch to their work.
-
 Confusion Misunderstanding Uncertainty Illustration
This PowerPoint Illustration depicts a person with a confused expression, surrounded by a bright, colourful background. It is perfect for illustrating confusion, uncertainty, or lack of knowledge in any presentation.
-
 Data Analytical Research Analysis Statistical Illustration
This colourful PowerPoint Illustration is perfect for illustrating data analytical research. It features a magnifying glass and a graph, representing the process of collecting and analyzing data. Its ideal for presentations, reports, and other documents.
-
 Workplace Conflict Resolution Management Illustration
This coloured powerpoint icon is a visual representation of workplace conflict resolution management. It provides a comprehensive overview of the steps and strategies needed to resolve conflicts in the workplace and ensure a healthy and productive environment.
-
 Blockchain Process Flow For Advanced Logistics Illustration
This coloured powerpoint Illustration provides a visual representation of the blockchain process flow for advanced logistics solutions. It is an essential tool for understanding the complexities of supply chain management and the potential of blockchain technology.
-
 Business Strategy Advantage Corporate Planning Illustration
This coloured powerpoint icon is perfect for illustrating business strategy. It features a vibrant and modern design, making it ideal for presentations, reports, and other visual materials. It is sure to make your presentations stand out and help your audience understand your business strategy.
-
 Innovation Idea Creativity Invention Illustration
This coloured PowerPoint icon is perfect for representing innovation ideas. It features a lightbulb with a colourful background, making it eye-catching and visually appealing. It is a great way to bring your ideas to life and make them stand out from the crowd.
-
 Project Management Deadline Scheduling With Check Illustration
This colourful PowerPoint Illustration is the perfect visual representation of a project deadline with a checkmark. It is a great way to visually communicate the importance of meeting deadlines and achieving goals.
-
 Business Achieving The Goal Successfully Illustration
This coloured PowerPoint Illustration is perfect for illustrating the concept of business success. It features a vibrant colour palette and a modern design, making it an ideal choice for presentations and other visuals related to achieving goals and success in business.
-
 Lead Generation Strategy Content Email Marketing Illustration
This colourful PowerPoint Illustration is a visual representation of a lead generation strategy. It is perfect for presentations to help illustrate the process of generating leads and converting them into customers.
-
 Cleaning Business Service Plan Business Strategy Illustration
This coloured PowerPoint Illustration on Recruitment Strategy for Hiring Right Candidates will help you develop a comprehensive plan to attract and select the best talent for your organization. It will provide you with the tools and techniques to identify the right candidates for the job and ensure a successful recruitment process.
-
 Company Financial Plan Budgeting Forecasting Illustration
This coloured powerpoint Illustration is the perfect visual aid to demonstrate a companys financial plan. It features a graph, chart and other visuals to help explain the financial plan in an easy to understand manner. It can be used in presentations, reports, and other documents to help illustrate the companys financial plan.
-
 Finance AI Application Improving Operations With Machine Learning Illustration
This coloured powerpoint Illustration is perfect for illustrating the use of Finance AI Application to improve operations with Machine Learning. It features a vibrant and modern design, and is perfect for presentations, websites, and other digital media.
-
 Revolutionizing Finance With AI Trends And Opportunities Illustration
This coloured PowerPoint Illustration provides an overview of the trends and opportunities in revolutionizing finance with AI. It is an ideal resource for financial professionals looking to stay ahead of the curve and capitalize on the latest AI advancements.
-
 Phase Gate Process Milestones Project Management Illustration
This colourful PowerPoint icon is a visual representation of the Phase Gate Process, a systematic approach to project management. It is designed to help teams track progress, identify risks, and ensure that projects are completed on time and within budget. The icon is a great way to illustrate the process and make it easier to understand.
-
 Agile Project Management Scrum Kanban Illustration
This coloured powerpoint Illustration is perfect for illustrating Agile Project Management concepts. It is bright and vibrant and will make your presentation stand out. It is easy to customize and can be used to create engaging visuals that will help you explain Agile Project Management in a simple and effective way.
-
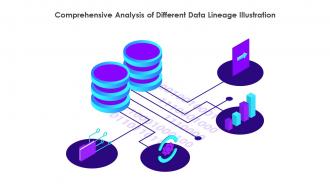 Comprehensive Analysis Of Different Data Lineage Illustration
This coloured PowerPoint icon is a visual representation of a comprehensive analysis of different data lineage classification. It is a helpful tool for understanding the complexities of data lineage and how it affects data processing. It is an ideal resource for data scientists and professionals alike.
-
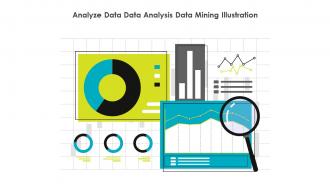 Analyze Data Data Analysis Data Mining Illustration
This colourful PowerPoint icon depicts a person analyzing data. It is perfect for presentations about data analysis, data science, and data visualization. It can be used to illustrate the importance of data analysis and its impact on decision-making.
-
 Agile Project Management Illustration
This coloured PowerPoint Illustration is perfect for Agile projects. It features a bright, cheerful design with a vibrant colour palette that will help to bring your presentation to life. It is easy to use and will make your presentation stand out.
-
 Risk Procedure Compliance Security Illustration
This colourful PowerPoint Illustration is a visual representation of the Risk Procedure. It is a helpful tool for quickly understanding the process and for making the procedure easier to remember.
-
 Data Analysis Data Mining Machine Learning Illustration
This colourful Illustration is perfect for data analysis presentations. It is a visual representation of data analysis, with a graph and magnifying glass to show the process of collecting and analyzing information. It is a great way to illustrate the importance of data analysis in business.
-
 CEOs Office Executive Leadership Top Management Illustration
This colourful PowerPoint Illustration features a CEOs office, complete with a desk, chair, and laptop. Perfect for presentations on leadership, management, and corporate culture. Ideal for business professionals looking to add a touch of style to their slides.
-
 Design Thinking Process Ideation User Research Illustration
This PowerPoint Illustration illustrates the design thinking process, featuring a colourful, creative design. It is perfect for presentations, webpages, and other documents to help explain the process of design thinking.
-
 Design Thinking Process Illustration
This colourful PowerPoint Illustration is a visual representation of the Design Thinking Process. It includes five steps empathise, define, ideate, prototype and test. Perfect for presentations on creative problem solving and innovation.
-
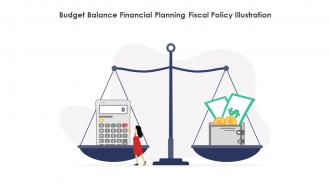 Budget Balance Financial Planning Fiscal Policy Illustration
This coloured powerpoint Illustration is perfect for presentations on budget balance. It features a large green arrow pointing up, signifying a balanced budget and financial success. It is an eye-catching and professional way to illustrate your message.
-
 Cogwheel Clockwork Gear Illustration
This cogwheel PowerPoint Illustration is a great visual aid for presentations. It is coloured in a vibrant blue and white, making it eye-catching and attention-grabbing. Perfect for any business or educational presentation.
-
 Business Management Leadership Strategy Illustration
This coloured PowerPoint Illustration is perfect for presentations on Business Management. It features a professional, modern design with a bright colour palette to help you stand out. Great for adding visual appeal to your slides.
-
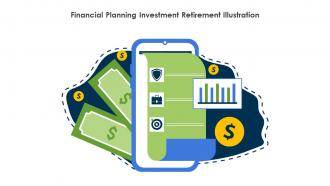 Financial Planning Investment Retirement Illustration
This colourful Illustration is a great visual aid for presentations on financial planning. It can be used to illustrate concepts such as budgeting, investments, and retirement planning. Perfect for business and finance related topics.
-
 Deployment Of Effective Credit Card Marketing Strategy Illustration
This colourful PowerPoint Illustration is perfect for illustrating the deployment of an effective credit card marketing strategy. It features a credit card, a laptop, and a graph to show the results of the strategy. Its a great visual tool to help you explain the process of deploying a successful credit card marketing plan.
-
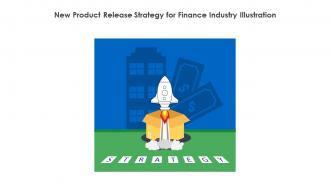 New Product Release Strategy For Finance Industry Illustration
This coloured PowerPoint icon provides a comprehensive overview of the new product release strategy for finance industry. It includes key steps, considerations and best practices for successful product launches.
-
 Client Schedule Meeting Appointment Conference Call Illustration
This coloured PowerPoint icon is perfect for representing a client schedule meeting. It features a green and blue calendar with a clock in the center, symbolizing the importance of timing for a successful meeting.
-
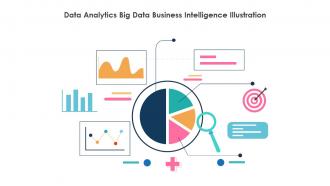 Data Analytics Big Data Business Intelligence Illustration
This colourful PowerPoint icon on Data Analytics is perfect for presentations, reports, and other documents. It features a vibrant blue, green and yellow colour palette and a high-quality design that will bring life to any project. Its the perfect way to illustrate data-driven insights and analytics in a visually appealing way.
-
 Maximizing Efficiency Streamlining Automation Illustration
This colored PowerPoint icon is designed to help maximize efficiency. It features a vibrant yellow background with a blue and white arrow pointing upwards, symbolizing progress and success. Its perfect for presentations on productivity and time management.
-
 Learning Process Knowledge Acquisition Data Analysis Illustration
This coloured powerpoint icon is the perfect visual aid to illustrate the learning process. It is vibrant and eye-catching, making it ideal for presentations or educational materials. It can be easily resized and edited to fit any project. Perfect for teachers, students, and professionals alike.
-
 EDW System To Improve Business Operational Efficiency Illustration
This coloured PowerPoint Illustration is a visual representation of EDW System to Improve Operational Efficiency. It is designed to help businesses streamline their processes and increase efficiency, resulting in improved productivity and cost savings.
-
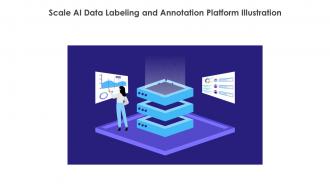 Scale AI Data Labeling And Annotation Platform Illustration
Scale AIs Data Labeling and Annotation Platform is a powerful tool for quickly and accurately labeling and annotating data. It features a colourful Illustration , making it easy to use and navigate. Its intuitive interface allows users to quickly label and annotate data with ease.
-
 Exit Strategy Business Plan Risk Management Illustration
This coloured powerpoint Illustration is perfect for illustrating an exit strategy. It features a bright blue arrow pointing up, surrounded by a circle of green, yellow and red. Its a great way to visually represent a successful plan of action.
-
 Employee Performance Appraisal Review Evaluation Illustration
This coloured powerpoint Illustration is perfect for any Employee Performance Review presentation. It features a colourful design with a professional look and feel, making it an ideal choice for any business or organisation. Its easy to use and can be customised to fit your needs.
-
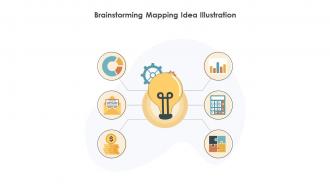 Brainstorming Mapping Idea Illustration
This colourful PowerPoint Illustration is perfect for brainstorming mapping ideas. It features a map with pins and a lightbulb to represent creative thinking. Use it to easily create visualisations of your ideas and plans for any project.
-
 Girl Celebrating An Employee Of The Year Achievement Illustration
This vibrant and cheerful PowerPoint Illustration features a female employee celebrating her Employee of the Year award. Perfect for presentations on success, recognition, and achievements.
-
 Collaborative Effort Teamwork Cooperation Illustration
This coloured powerpoint icon is the perfect visual representation of collaborative effort. It features a group of people working together to achieve a common goal, and is sure to add a vibrant and meaningful touch to any presentation.
-
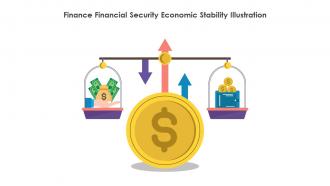 Finance Financial Security Economic Stability Illustration
This coloured powerpoint icon is perfect for presentations on finance stability. It features a graph and a dollar sign in a bright, modern colour palette, making it a great visual aid for any financial presentation.
-
 Return On Investment Illustration
This coloured PowerPoint icon displays a graphical representation of Return on Investment ROI, making it easy to explain complex concepts to your audience. The vibrant colours and simple design make it an attractive addition to any presentation.
-
 Energy Security Renewable Energy Fossil Fuels Illustration
This coloured PowerPoint icon is an illustration of energy security. It is a vector graphic of a lightbulb with a green and blue colour scheme, representing renewable energy sources. It is perfect for presentations on energy security and sustainability.
-
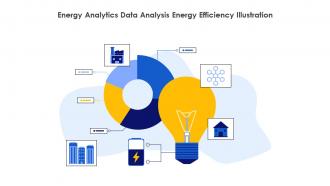 Energy Analytics Data Analysis Energy Efficiency Illustration
This colourful PowerPoint icon is perfect for presentations on energy analytics. It features a graph with a green and yellow background, representing the rise and fall of energy consumption. Its a great visual aid for any energy-related discussion.
-
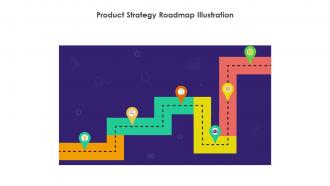 Product Strategy Roadmap Illustration
This vibrant and colourful PowerPoint icon is perfect for illustrating product strategy roadmap presentations. It is a great visual aid to help you communicate your product strategy and plans to stakeholders.
-
 Natural Language Processing IT Illustration
This coloured PowerPoint icon is a perfect visual representation of Natural Language Processing NLP, a branch of Artificial Intelligence used for understanding and interpreting human language. It is a great addition to any presentation on the topic, helping to explain and illustrate the concept in a clear and concise manner.
-
 Minimizing Risk Performance With Business Analysis Illustration
This coloured PowerPoint icon is a visual representation of a comprehensive analysis of different data lineage classification. It is a helpful tool for understanding the complexities of data lineage and how it affects data processing. It is an ideal resource for data scientists and professionals alike.
-
 Work Deadline Task Completion Time Management Illustration
This colourful PowerPoint icon is perfect for representing work deadlines. It features a bright orange clock face with a red hand pointing to the deadline hour. A blue background with yellow stars adds a touch of fun. Perfect for any presentation.


