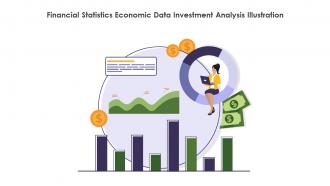
Financial Statistics Economic Data Investment Analysis Illustration
Use this Financial statistics economic data investment analysis illustration and create amazing PowerPoint presentations or graphics with ease. This downloaded file is available in all the editable formats such as EPS, PNG and Powerpoint pptx.
You must be logged in to download this presentation.
PowerPoint presentation slides
This coloured PowerPoint Illustration is a visual representation of financial statistics. It features a graph with a blue line, a green bar, and a red arrow. The Illustration is ideal for presentations and reports related to financial data.
Financial Statistics Economic Data Investment Analysis Illustration with all 6 slides:
Use our Financial Statistics Economic Data Investment Analysis Illustration to effectively help you save your valuable time. They are readymade to fit into any presentation structure.
-
I want to express my gratitude to SlideTeam’s presentation design services team for helping me create the best presentation of my life!
-
Perfect template with attractive color combination.


