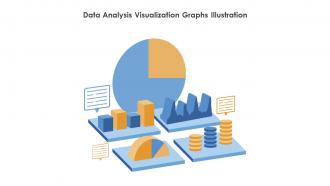
Data Analysis Visualization Graphs Illustration
Use this Data analysis visualization graphs illustration and create amazing PowerPoint presentations or graphics with ease. This downloaded file is available in all the editable formats such as EPS, PNG and Powerpoint pptx.
You must be logged in to download this presentation.
PowerPoint presentation slides
Brightly powerpoint Illustration with a bar graph to represent data visualization. Perfect for presentations, reports, and other documents to illustrate data points and trends.
Data Analysis Visualization Graphs Illustration with all 6 slides:
Use our Data Analysis Visualization Graphs Illustration to effectively help you save your valuable time. They are readymade to fit into any presentation structure.
-
I loved the hassle-free signup process. A few minutes and, I had this giant collection of beautiful designs.
-
Much better than the original! Thanks for the quick turnaround.


