All KPIs Supply Chain Powerpoint Diagram Slide
-
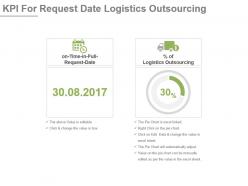 Kpi for request date logistics outsourcing powerpoint slide
Presenting kpi for request date logistics outsourcing powerpoint slide. This presentation slide shows Two Key Performance Indicators or KPIs in a Dashboard style design. The first KPI that can be shown is on Time in Full Request Date. The second KPI is Percentage of Logistics Outsourcing. These KPI Powerpoint graphics are all data driven, and the shape automatically adjusts according to your data. Just right click on the KPI graphic, enter the right value and the shape will adjust automatically. Make a visual impact with our KPI slides.
-
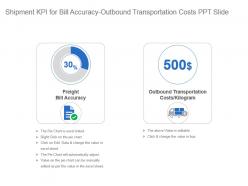 Shipment kpi for bill accuracy outbound transportation costs ppt slide
Presenting shipment kpi for bill accuracy outbound transportation costs ppt slide. This presentation slide shows two Key Performance Indicators or KPIs in a Dashboard style design. The first KPI that can be shown is Freight Bill Accuracy. The second KPI is Outbound Transportation Costs Kilogram. These KPI Powerpoint graphics are all data driven, and the shape automatically adjusts according to your data. Just right click on the KPI graphic, enter the right value and the shape will adjust automatically. Make a visual impact with our KPI slides.
-
 Ontime value kpi for orders damage shipments ppt slide
Presenting ontime value kpi for orders damage shipments ppt slide. This presentation slide shows two Key Performance Indicators or KPIs in a Dashboard style design. The first KPI that can be shown is Orders, Correct Documentation. The second KPI is Orders, Damage Shipments. These KPI Powerpoint graphics are all data driven, and the shape automatically adjusts according to your data. Just right click on the KPI graphic, enter the right value and the shape will adjust automatically. Make a visual impact with our KPI slides.
-
 Key metrics in reverse logistics reverse supply chain management ppt infographics
The purpose of this slide is to provide information regarding important parameters that are use to determine the reverse logistics process.Deliver an outstanding presentation on the topic using this Key Metrics In Reverse Logistics Reverse Supply Chain Management Ppt Infographics. Dispense information and present a thorough explanation of Customer Metrics, Operations Metrics, Capacity And Quality Metrics using the slides given. This template can be altered and personalized to fit your needs. It is also available for immediate download. So grab it now.
-
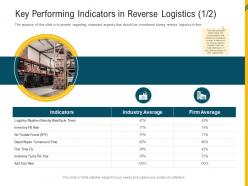 Key performing indicators in reverse logistics firm reverse supply chain management ppt template
The purpose of this slide is to provide regarding important aspects that should be considered during reverse logistics in firm.Deliver an outstanding presentation on the topic using this Key Performing Indicators In Reverse Logistics Firm Reverse Supply Chain Management Ppt Template. Dispense information and present a thorough explanation of Depot Repair Turnaround Time, Inventory Fill Rate, Indicators using the slides given. This template can be altered and personalized to fit your needs. It is also available for immediate download. So grab it now.
-
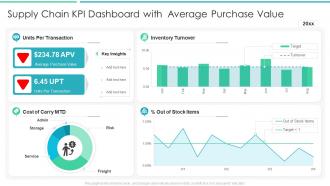 Supply chain kpi dashboard with average purchase value
Presenting our well-structured Supply Chain KPI Dashboard With Average Purchase Value. The topics discussed in this slide are Inventory Turnover, Key Insights, Cost. This is an instantly available PowerPoint presentation that can be edited conveniently. Download it right away and captivate your audience.
-
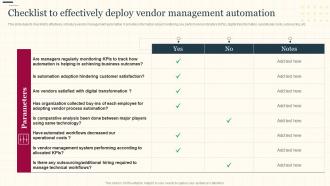 Increasing Supply Chain Value Checklist To Effectively Deploy Vendor Management Automation
This slide depicts checklist to effectively introduce vendor management automation. It provides information about monitoring, key performance indicators KPIs, digital transformation, operational costs, outsourcing, etc. Present the topic in a bit more detail with this Increasing Supply Chain Value Checklist To Effectively Deploy Vendor Management Automation. Use it as a tool for discussion and navigation on Business Outcomes, Digital Transformation, Operational Costs. This template is free to edit as deemed fit for your organization. Therefore download it now.
-
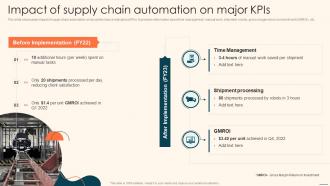 Impact Of Supply Chain Automation On Major KPIS Deploying Automation Manufacturing
This slide showcases impact of supply chain automation on key performance indicators KPIs. It provides information about time management, manual work, shipment, robots, gross margin return on investment GMROI, etc. Present the topic in a bit more detail with this Impact Of Supply Chain Automation On Major KPIS Deploying Automation Manufacturing. Use it as a tool for discussion and navigation on Time Management, Shipment Processing, Before Implementation. This template is free to edit as deemed fit for your organization. Therefore download it now.
-
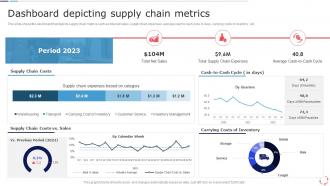 Dashboard Depicting Supply Chain Metrics Models For Improving Supply Chain Management
This slide shows the dashboard that depicts supply chain metrics such as total net sales, supply chain expenses, average cash to cash cycle in days, carrying costs of inventory, etc. Deliver an outstanding presentation on the topic using this Dashboard Depicting Supply Chain Metrics Models For Improving Supply Chain Management. Dispense information and present a thorough explanation of Dashboard Depicting, Supply Chain Metrics using the slides given. This template can be altered and personalized to fit your needs. It is also available for immediate download. So grab it now.


