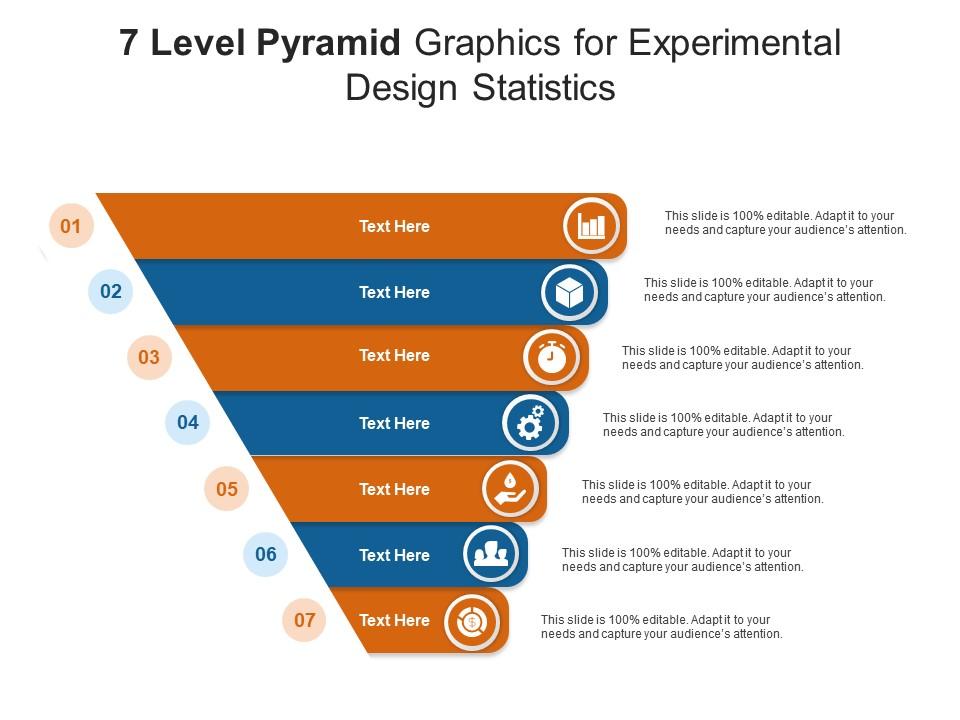
7 level pyramid graphics for experimental design statistics infographic template
This 7 Level Pyramid Graphics For Experimental Design Statistics Infographic Template is a professionally drafted slide that can be deployed by managers, executives, owners, consultants, and other individuals to make their presentation more visually appealing. This layout helps the viewers gain quality information in less amount of time, thus conveying your message in the best possible manner. It reinforces the topics presented and makes their explanation more simplified, which is why this infographic template will suit any professional domain. Its vivid colors, graphics, design, etc., not only increases the aesthetics of the slideshows but also initiates immediate action. One of the advantages of downloading this PowerPoint design is that it can be reproduced as PNGs, JPGs, and PDFs that can be stored for further application. Hence, without indulging in a vigorous brainstorming session, download this layout now.
- Google Slides is a new FREE Presentation software from Google.
- All our content is 100% compatible with Google Slides.
- Just download our designs, and upload them to Google Slides and they will work automatically.
- Amaze your audience with SlideTeam and Google Slides.
-
Want Changes to This PPT Slide? Check out our Presentation Design Services
- WideScreen Aspect ratio is becoming a very popular format. When you download this product, the downloaded ZIP will contain this product in both standard and widescreen format.
-

- Some older products that we have may only be in standard format, but they can easily be converted to widescreen.
- To do this, please open the SlideTeam product in Powerpoint, and go to
- Design ( On the top bar) -> Page Setup -> and select "On-screen Show (16:9)” in the drop down for "Slides Sized for".
- The slide or theme will change to widescreen, and all graphics will adjust automatically. You can similarly convert our content to any other desired screen aspect ratio.
Compatible With Google Slides

Get This In WideScreen
You must be logged in to download this presentation.
PowerPoint presentation slides
This is our 7 Level Pyramid Graphics For Experimental Design Statistics Infographic Template designed in PowerPoint, however, you can also access it in Google Slides. It comes in two aspect ratios standard and widescreen, with fully editable visual content.
7 level pyramid graphics for experimental design statistics infographic template with all 2 slides:
Use our 7 Level Pyramid Graphics For Experimental Design Statistics Infographic Template to effectively help you save your valuable time. They are readymade to fit into any presentation structure.
-
Editable templates with innovative design and color combination.


