11683653 style layered vertical 10 piece powerpoint presentation diagram infographic slide
Our App Business Analysis Vs Business Intelligence Diagram Powerpoint Layout come at an attractive cost. They help chip away at expenses.
You must be logged in to download this presentation.
PowerPoint presentation slides
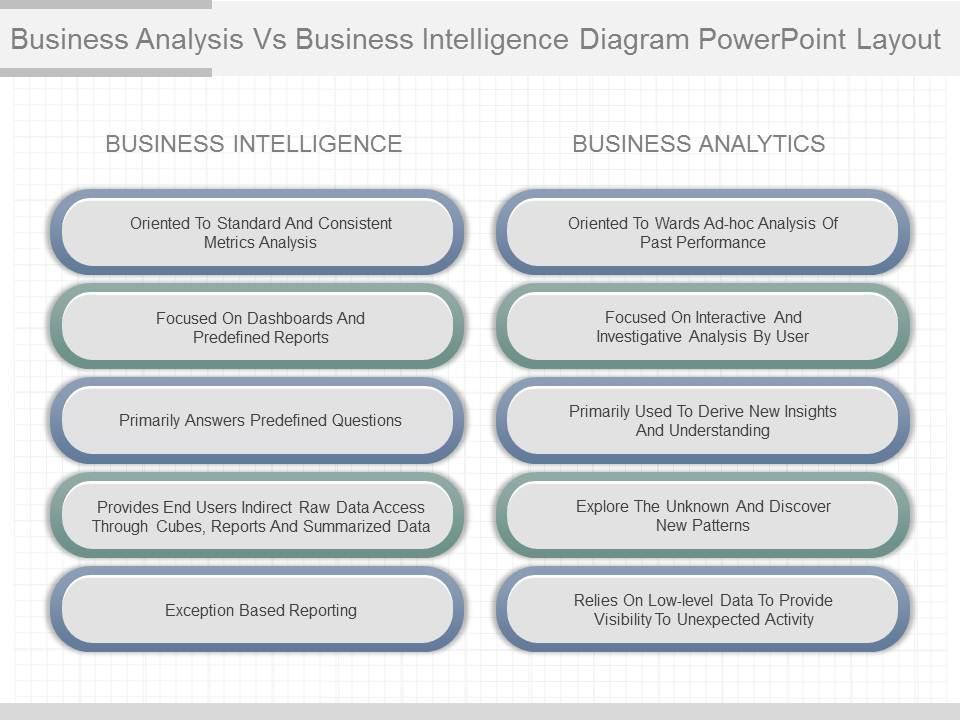
Presenting app business analysis vs business intelligence diagram powerpoint layout. This is a business analysis vs business intelligence diagram powerpoint layout. This is a ten stage process. The stages in this process are oriented to standard and consistent metrics analysis, focused on dashboards and predefined reports, primarily answers predefined questions, provides end users indirect raw data access through cubes, reports and summarized data, exception based reporting, oriented to wards ad-hoc analysis of past performance, focused on interactive and investigative analysis by user , primarily used to derive new insights and understanding.
11683653 style layered vertical 10 piece powerpoint presentation diagram infographic slide with all 7 slides:
Hand down your best with our App Business Analysis Vs Business Intelligence Diagram Powerpoint Layout. Give them a great example to follow.
-
Awesomely designed templates, Easy to understand.
-
Understandable and informative presentation.


