18337558 style layered vertical 5 piece powerpoint presentation diagram infographic slide
Benefit from the efforts of our 5 Sliding Scale Designs Ppt Examples Slides team. They have created the right vehicle for your ideas.
Benefit from the efforts of our 5 Sliding Scale Designs Ppt Examples Slides team. They have created the right vehicle for y..
- Google Slides is a new FREE Presentation software from Google.
- All our content is 100% compatible with Google Slides.
- Just download our designs, and upload them to Google Slides and they will work automatically.
- Amaze your audience with SlideTeam and Google Slides.
-
Want Changes to This PPT Slide? Check out our Presentation Design Services
- WideScreen Aspect ratio is becoming a very popular format. When you download this product, the downloaded ZIP will contain this product in both standard and widescreen format.
-

- Some older products that we have may only be in standard format, but they can easily be converted to widescreen.
- To do this, please open the SlideTeam product in Powerpoint, and go to
- Design ( On the top bar) -> Page Setup -> and select "On-screen Show (16:9)” in the drop down for "Slides Sized for".
- The slide or theme will change to widescreen, and all graphics will adjust automatically. You can similarly convert our content to any other desired screen aspect ratio.
Compatible With Google Slides

Get This In WideScreen
You must be logged in to download this presentation.
PowerPoint presentation slides
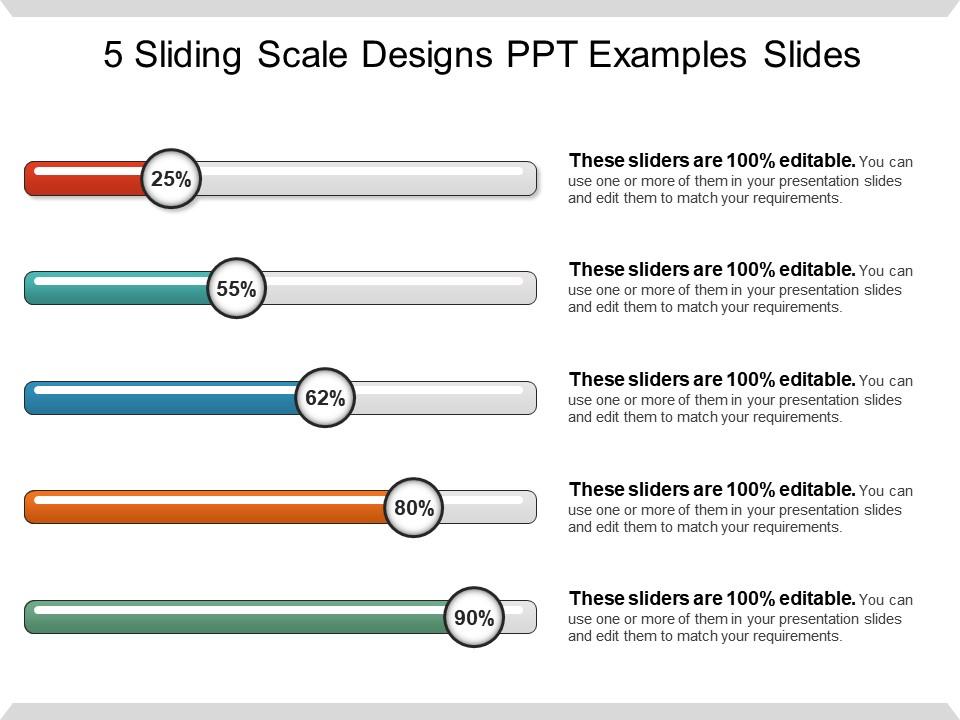
Presenting 5 sliding scale designs ppt examples slides. This is a 5 sliding scale designs ppt examples slides. This is a five stage process. The stages in this process are sliding scale, sliding bar.
Content of this Powerpoint Presentation
Description:
The image shows a PowerPoint slide titled "5 Sliding Scale Designs PPT Examples Slides." The slide features five horizontal sliding scale graphics, each representing a percentage value. These sliding scales are visually designed to indicate progress or level of completion, with different colors for each bar and a circular indicator showing the percentage achieved:
The first scale is red, showing 25% completion.
The second is teal, indicating 55% completion.
The third is blue, showing 62% completion.
The fourth is orange, representing 80% completion.
The fifth is green, indicating 90% completion.
Beside each sliding scale, there is a note stating, "These sliders are 100% editable. You can use one or more of them in your presentation slides and edit them to match your requirements." This suggests that the slides can be customized for different presentations, with the ability to alter the percentage values and colors as needed.
Use Cases:
Such sliding-scale designs can be utilized across various industries for multiple purposes:
1. Sales:
Use: Tracking sales targets and achievements.
Presenter: Sales Manager
Audience: Sales team, company executives
2. Project Management:
Use: Showing project milestones and progress.
Presenter: Project Coordinator
Audience: Project team members, stakeholders
3. Education:
Use: Indicating student progress in different subjects.
Presenter: Teacher
Audience: Students, parents, educational staff
4. Healthcare:
Use: Monitoring patient health improvement or treatment progress.
Presenter: Healthcare Provider
Audience: Patients, medical team
5. Human Resources:
Use: Visualizing employee performance reviews.
Presenter: HR Manager
Audience: Employees, department heads
6. Finance:
Use: Demonstrating financial goals and fiscal health of departments.
Presenter: Financial Analyst
Audience: Investors, management team
7. Manufacturing:
Use: Representing efficiency or output levels of production lines.
Presenter: Operations Manager
Audience: Production staff, management
18337558 style layered vertical 5 piece powerpoint presentation diagram infographic slide with all 5 slides:
Convey your belief in being forthright with our 5 Sliding Scale Designs Ppt Examples Slides. It helps avoid any brinksmanship.
-
Informative design.
-
Graphics are very appealing to eyes.


