All Maps China map Powerpoint Diagram Slide
-
 Intel corporation china revenue 2014-2018
This is a professionally designed visual chart for Intel Corporation China Revenue 2014 to 2018. This is part of our Data and Statistics products selection, and you will need a Paid account to download the actual report with accurate data and sources. Downloaded report will contain the editable graph with accurate data, an excel table with the actual data, the exact source of the data and the release date. This slide provides a graph of Revenue in JPY MM of Intel Corporation from China including Hong Kong region for the years 2014 to 2018. Download it immediately and use it for your business.
-
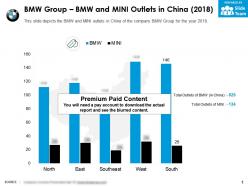 Bmw group bmw and mini outlets in china 2018
This is a professionally designed visual chart for BMW Group BMW And Mini Outlets In China 2018. This is part of our Data and Statistics products selection, and you will need a Paid account to download the actual report with accurate data and sources. Downloaded report will contain the editable graph with accurate data, an excel table with the actual data, the exact source of the data and the release date. This slide depicts the BMW and MINI outlets in China of the company BMW Group for the year 2018. Download it immediately and use it for your business.
-
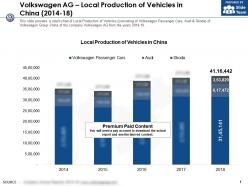 Volkswagen ag local production of vehicles in china 2014-18
This is a professionally designed visual chart for Volkswagen Ag Local Production Of Vehicles In China 2014 to 18. This is part of our Data and Statistics products selection, and you will need a Paid account to download the actual report with accurate data and sources. Downloaded report will contain the editable graph with accurate data, an excel table with the actual data, the exact source of the data and the release date. This slide provides a stack chart of Local Production of Vehicles consisting of Volkswagen Passenger Cars, Audi and Skoda of Volkswagen Group China of the company Volkswagen AG from the years 2014 to 18. Download it immediately and use it for your business.
-
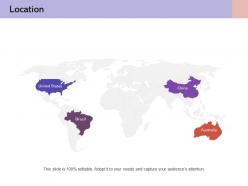 56105695 style essentials 1 location 4 piece powerpoint presentation diagram infographic slide
Presenting this set of slides with name - Location China Knowledge Strategy Action Drive United States. This is a four stage process. The stages in this process are Location, China, Knowledge, Strategy, Action Drive, United States.
-
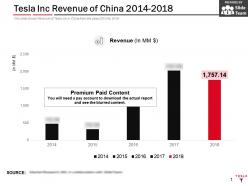 Tesla inc revenue of china 2014-2018
This is a professionally designed visual chart for Tesla Inc Revenue Of China 2014 to 2018. This is part of our Data and Statistics products selection, and you will need a Paid account to download the actual report with accurate data and sources. Downloaded report will contain the editable graph with accurate data, an excel table with the actual data, the exact source of the data and the release date. This slide shows Revenue of Tesla Inc in China from the years 2014 to 2018. Download it immediately and use it for your business.
-
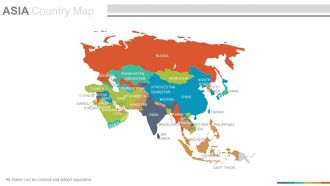 Maps of the asian asia continent countries in powerpoint
This PPT Template can be used by Professionals from a diverse background for displaying their business location and corporate communication in Asia Continent. The maps used on this slide are all vector based and can be edited in a Powerpoint software, you can edit the text area and include it wherever you want on the slide. The stages in this process are kazakhstan, india, bahrain, pakistan, china, bangladesh, japan, malaysia.
-
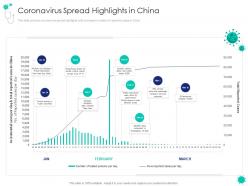 Coronavirus spread highlights in china covid 19 introduction response plan economic effect landscapes
This slide portrays coronavirus spread highlights with increase in number of reported cases in Italy. Deliver an outstanding presentation on the topic using this Coronavirus Spread Highlights In China Covid 19 Introduction Response Plan Economic Effect Landscapes. Dispense information and present a thorough explanation of Coronavirus Spread Highlights In Italy using the slides given. This template can be altered and personalized to fit your needs. It is also available for immediate download. So grab it now.
-
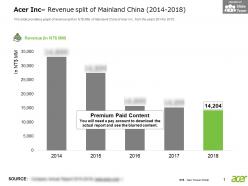 Acer inc revenue split of mainland china 2014-2018
This is a professionally designed visual chart for Acer Inc Revenue Split Of Mainland China 2014 to 2018. This is part of our Data and Statistics products selection, and you will need a Paid account to download the actual report with accurate data and sources. Downloaded report will contain the editable graph with accurate data, an excel table with the actual data, the exact source of the data and the release date. This slide provides a graph of revenue split in NT JPY MM of Mainland China of Acer Inc from the years 2014 to 2018. Download it immediately and use it for your business.
-
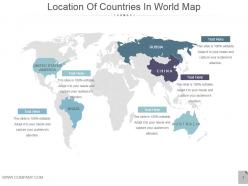 9097931 style essentials 1 location 5 piece powerpoint presentation diagram infographic slide
Presenting location of countries in world map powerpoint slides. This is a location of countries in world map powerpoint slides. This is a five stage process. The stages in this process are united states america, brazil, russia, china, australia.
-
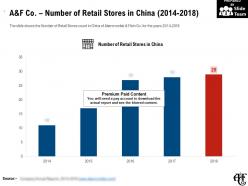 A and f co number of retail stores in china 2014-2018
This is a professionally designed visual chart for A And F Co Number Of Retail Stores In China 2014 to 2018. This is part of our Data and Statistics products selection, and you will need a Paid account to download the actual report with accurate data and sources. Downloaded report will contain the editable graph with accurate data, an excel table with the actual data, the exact source of the data and the release date. The slide shows the Number of Retail Stores count in China of Abercrombie and Fitch Co. for the years 2014 to 2018. Download it immediately and use it for your business.
-
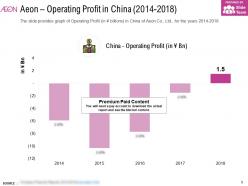 Aeon operating profit in china 2014-2018
This is a professionally designed visual chart for Aeon Operating Profit In China 2014 to 2018. This is part of our Data and Statistics products selection, and you will need a Paid account to download the actual report with accurate data and sources. Downloaded report will contain the editable graph with accurate data, an excel table with the actual data, the exact source of the data and the release date. The slide provides graph of Operating Profit in JPY billions in China of Aeon Co. Ltd. for the years 2014 to 2018. Download it immediately and use it for your business.
-
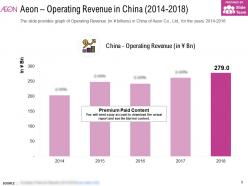 Aeon operating revenue in china 2014-2018
This is a professionally designed visual chart for Aeon Operating Revenue In China 2014 to 2018. This is part of our Data and Statistics products selection, and you will need a Paid account to download the actual report with accurate data and sources. Downloaded report will contain the editable graph with accurate data, an excel table with the actual data, the exact source of the data and the release date. The slide provides graph of Operating Revenue in JPY billions in China of Aeon Co. Ltd. for the years 2014 to 2018. Download it immediately and use it for your business.
-
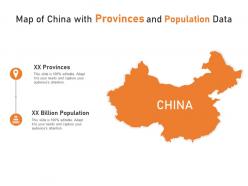 Map of china with provinces and population data
Presenting our set of slides with name Map Of China With Provinces And Population Data. This exhibits information on two stages of the process. This is an easy-to-edit and innovatively designed PowerPoint template. So download immediately and highlight information on Map Of China With Provinces And Population Data.
-
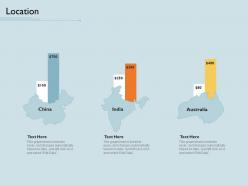 Location china m1797 ppt powerpoint presentation slides microsoft
Presenting this set of slides with name Location China M1797 Ppt Powerpoint Presentation Slides Microsoft. This is a three stage process. The stages in this process are Location. This is a completely editable PowerPoint presentation and is available for immediate download. Download now and impress your audience.
-
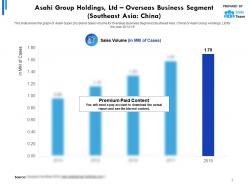 Asahi group holdings ltd statistic 1 overseas business segment southeast asia china
This is a professionally designed visual chart for Asahi Group Holdings Ltd Statistic 1 Overseas Business Segment Southeast Asia China. This is part of our Data and Statistics products selection, and you will need a Paid account to download the actual report with accurate data and sources. Downloaded report will contain the editable graph with accurate data, an excel table with the actual data, the exact source of the data and the release date. This slide shows the graph of Asahi Super Dry Brand Sales Volume for Overseas Business Segment Southeast Asia, China of Asahi Group Holdings, Ltd for the year 2014 to 18. Download it immediately and use it for your business.
-
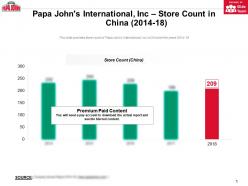 Papa johns international inc store count in china 2014-18
This is a professionally designed visual chart for Papa Johns International Inc Store Count In China 2014 to 18. This is part of our Data and Statistics products selection, and you will need a Paid account to download the actual report with accurate data and sources. Downloaded report will contain the editable graph with accurate data, an excel table with the actual data, the exact source of the data and the release date. This slide provides store count of Papa Johns International, Inc in China for the years 2014 to 18. Download it immediately and use it for your business.
-
 Flags of algeria china north korea and turkey hoisted together
Introducing our Flags Of Algeria China North Korea And Turkey Hoisted Together set of slides. The topics discussed in these slides are Flags Of Algeria China North Korea And Turkey Hoisted Together. This is an immediately available PowerPoint presentation that can be conveniently customized. Download it and convince your audience.
-
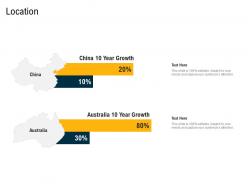 Location china m3111 ppt powerpoint presentation model example
Presenting this set of slides with name Location China M3111 Ppt Powerpoint Presentation Model Example. This is a two stage process. The stages in this process are Location. This is a completely editable PowerPoint presentation and is available for immediate download. Download now and impress your audience.
-
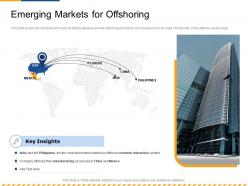 Emerging markets for offshoring to china ppt powerpoint presentation ideas example
This slide covers the countries which will be best suitable to provide offshoring services to our company such as India, Philippines, China, Mexico, and Europe. Presenting this set of slides with name Emerging Markets For Offshoring To China Ppt Powerpoint Presentation Ideas Example. The topics discussed in these slides are Emerging Markets For Offshoring. This is a completely editable PowerPoint presentation and is available for immediate download. Download now and impress your audience.
-
 Coronavirus disease 19 china statistics dashboard ppt powerpoint presentation icon gridlines
Presenting this set of slides with name Coronavirus Disease 19 China Statistics Dashboard Ppt Powerpoint Presentation Icon Gridlines. The topics discussed in these slides are Coronavirus Disease 19 China Statistics Dashboard. This is a completely editable PowerPoint presentation and is available for immediate download. Download now and impress your audience.
-
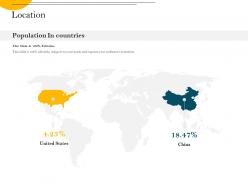 Location china m2356 ppt powerpoint presentation file portfolio
Presenting this set of slides with name Location China M2356 Ppt Powerpoint Presentation File Portfolio. This is a two stage process. The stages in this process are Location. This is a completely editable PowerPoint presentation and is available for immediate download. Download now and impress your audience.
-
 Template with beautiful fall scene with a pond and colorful trees in jiuzhaigou scenic area china
Bolster your presentation designs and make them impactful with our Template With Beautiful Fall Scene With A Pond And Colorful Trees In Jiuzhaigou Scenic Area China. This cutting edge PPT will help you meet your audience expectations due to its interactive design. Useful content has been added to help you convey your ideas vision and principle aspects more proficiently. Throw light on what is important and take your presentation game a notch higher with this multipurpose design that comes with an assortment of features. No matter what is the purpose of your presentation conveying business ideas proposals analysis reports or any other you will find this creative design template perfect for all the scenarios. Also input any information and keep your audience hooked with this content ready template that is fully editable and customizable. Besides this you can represent large sets of complex data and information with this template design that can be adopted by any industry agency individual or group to deliver awe inspiring presentations.


