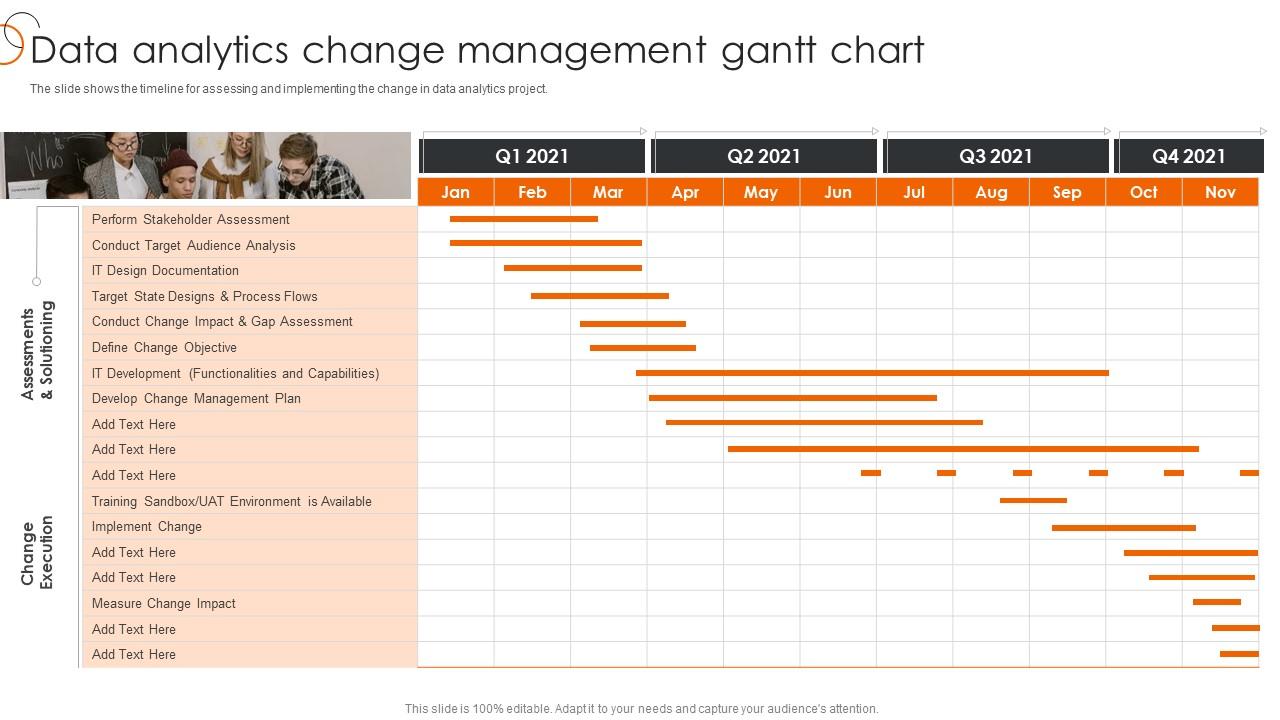
Data Analytics Change Management Gantt Chart Process Of Transforming Data Toolkit
The slide shows the timeline for assessing and implementing the change in data analytics project.
- Google Slides is a new FREE Presentation software from Google.
- All our content is 100% compatible with Google Slides.
- Just download our designs, and upload them to Google Slides and they will work automatically.
- Amaze your audience with SlideTeam and Google Slides.
-
Want Changes to This PPT Slide? Check out our Presentation Design Services
- WideScreen Aspect ratio is becoming a very popular format. When you download this product, the downloaded ZIP will contain this product in both standard and widescreen format.
-

- Some older products that we have may only be in standard format, but they can easily be converted to widescreen.
- To do this, please open the SlideTeam product in Powerpoint, and go to
- Design ( On the top bar) -> Page Setup -> and select "On-screen Show (16:9)” in the drop down for "Slides Sized for".
- The slide or theme will change to widescreen, and all graphics will adjust automatically. You can similarly convert our content to any other desired screen aspect ratio.
Compatible With Google Slides

Get This In WideScreen
You must be logged in to download this presentation.
PowerPoint presentation slides
The slide shows the timeline for assessing and implementing the change in data analytics project. Increase audience engagement and knowledge by dispensing information using Data Analytics Change Management Gantt Chart Process Of Transforming Data Toolkit. This template helps you present information on one stage. You can also present information on Change Execution, Assessments Solutioning, Data Analytics using this PPT design. This layout is completely editable so personaize it now to meet your audiences expectations.
Data Analytics Change Management Gantt Chart Process Of Transforming Data Toolkit with all 6 slides:
Use our Data Analytics Change Management Gantt Chart Process Of Transforming Data Toolkit to effectively help you save your valuable time. They are readymade to fit into any presentation structure.
-
Easily Understandable slides.
-
Kudos to SlideTeam for achieving the high success rate in delivering the top-notch slides.


