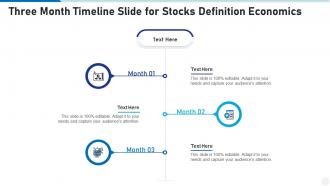
Three month timeline slide for stocks definition economics infographic template
This is a Three Month Timeline Slide For Stocks Definition Economics Infographic Template that can be used by professionals belonging to any domain. It is a powerful illustrative tool that can be deployed to showcase consumer behavior, sales reports, progress reports, IT research results, and many more. In short, this PPT layout works for every industry, irrespective of its operations. The combination of compelling information and visual content added in this template makes it a very resourceful layout to grab. Utilize it to present information and insightful details about your business or the finished product that can be visualized from the onset. This PPT design features high quality elements like graphics, icons, etc. that can be used to further enhance the illustrative properties of a presentation. It can also be reproduced as PNG, JPG and PDF, for the users convenience.
- Google Slides is a new FREE Presentation software from Google.
- All our content is 100% compatible with Google Slides.
- Just download our designs, and upload them to Google Slides and they will work automatically.
- Amaze your audience with SlideTeam and Google Slides.
-
Want Changes to This PPT Slide? Check out our Presentation Design Services
- WideScreen Aspect ratio is becoming a very popular format. When you download this product, the downloaded ZIP will contain this product in both standard and widescreen format.
-

- Some older products that we have may only be in standard format, but they can easily be converted to widescreen.
- To do this, please open the SlideTeam product in Powerpoint, and go to
- Design ( On the top bar) -> Page Setup -> and select "On-screen Show (16:9)” in the drop down for "Slides Sized for".
- The slide or theme will change to widescreen, and all graphics will adjust automatically. You can similarly convert our content to any other desired screen aspect ratio.
Compatible With Google Slides

Get This In WideScreen
You must be logged in to download this presentation.
PowerPoint presentation slides
This is our Three Month Timeline Slide For Stocks Definition Economics Infographic Template designed in PowerPoint, however, you can also access it in Google Slides. It comes in two aspect ratios standard and widescreen, with fully editable visual content.
Three month timeline slide for stocks definition economics infographic template with all 10 slides:
Use our Three Month Timeline Slide For Stocks Definition Economics Infographic Template to effectively help you save your valuable time. They are readymade to fit into any presentation structure.
-
Really like the color and design of the presentation.
-
Excellent work done on template design and graphics.
-
Very well designed and informative templates.


